Border Crossing Data Annual Release: 2023 - 2024Tuesday, February 18, 2025 BTS 10-25
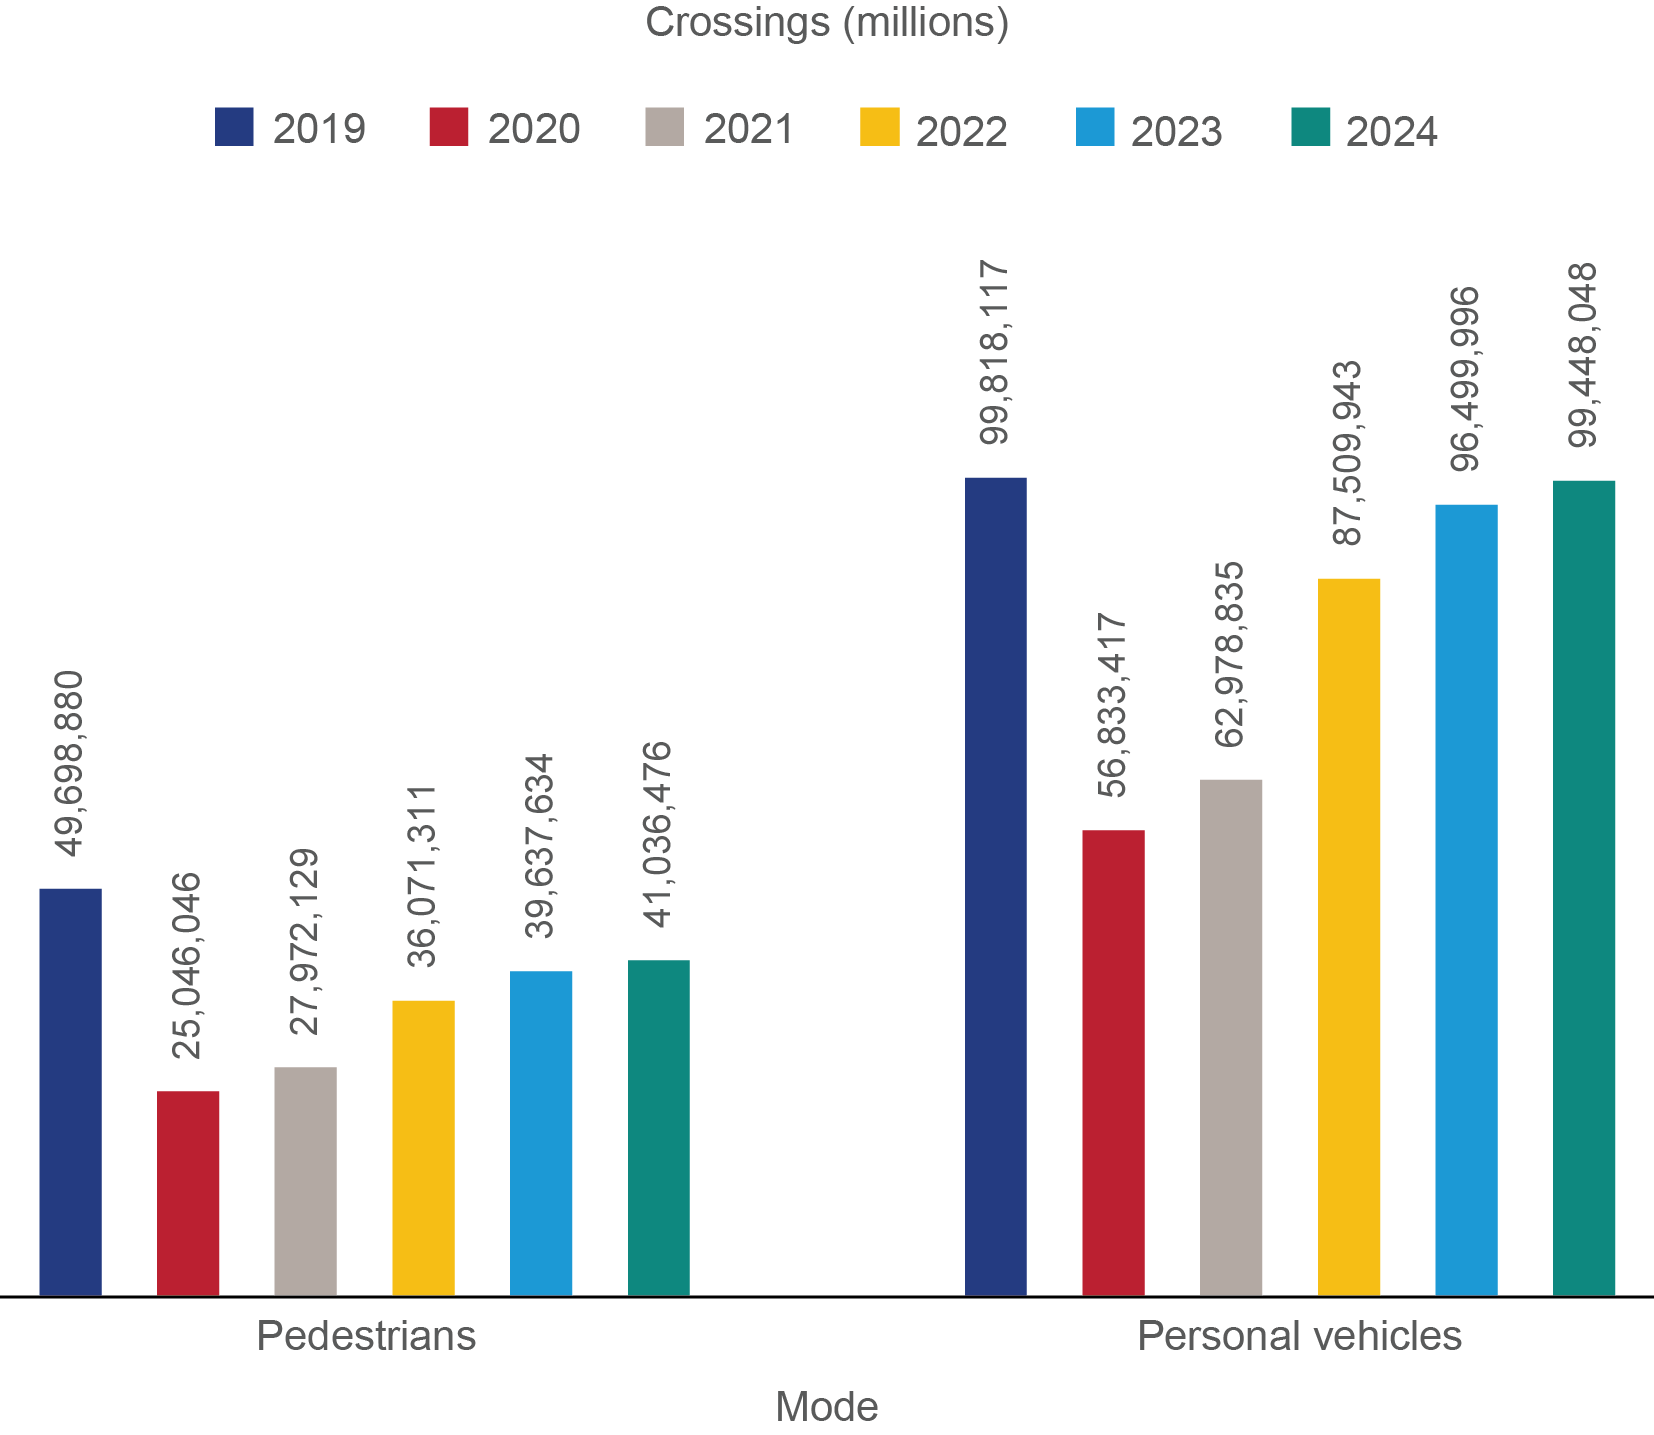
The Bureau of Transportation Statistics (BTS) Border Crossing Data provides summary statistics for inbound crossings at the U.S.-Canada and the U.S.-Mexico border at the port level. Data are available for trucks, trains, containers, buses, personal vehicles, passengers, and pedestrians. Border crossing data are collected at ports of entry by U.S. Customs and Border Protection (CBP) and sourced to BTS every month. The data reflect the number of vehicles, containers, passengers, or pedestrians entering the United States at official CBP land border crossing stations. CBP does not collect comparable data on outbound crossings. Users seeking data on outbound counts may therefore want to review data from individual bridge operators, border state governments, or the Mexican and Canadian governments. The source for data in this release is the Border Crossing data website: https://data.bts.gov/stories/s/jswi-2e7b Pedestrian and Personal vehicle crossings have steadily rose from the COVID-19 pandemic lows in 2020. However, as compared with 2019, pedestrian crossings were still 17.4 percent lower than 2024. Personal vehicle crossings were 0.4 percent lower.
Figure 1. Pedestrian and Vehicle Crossings
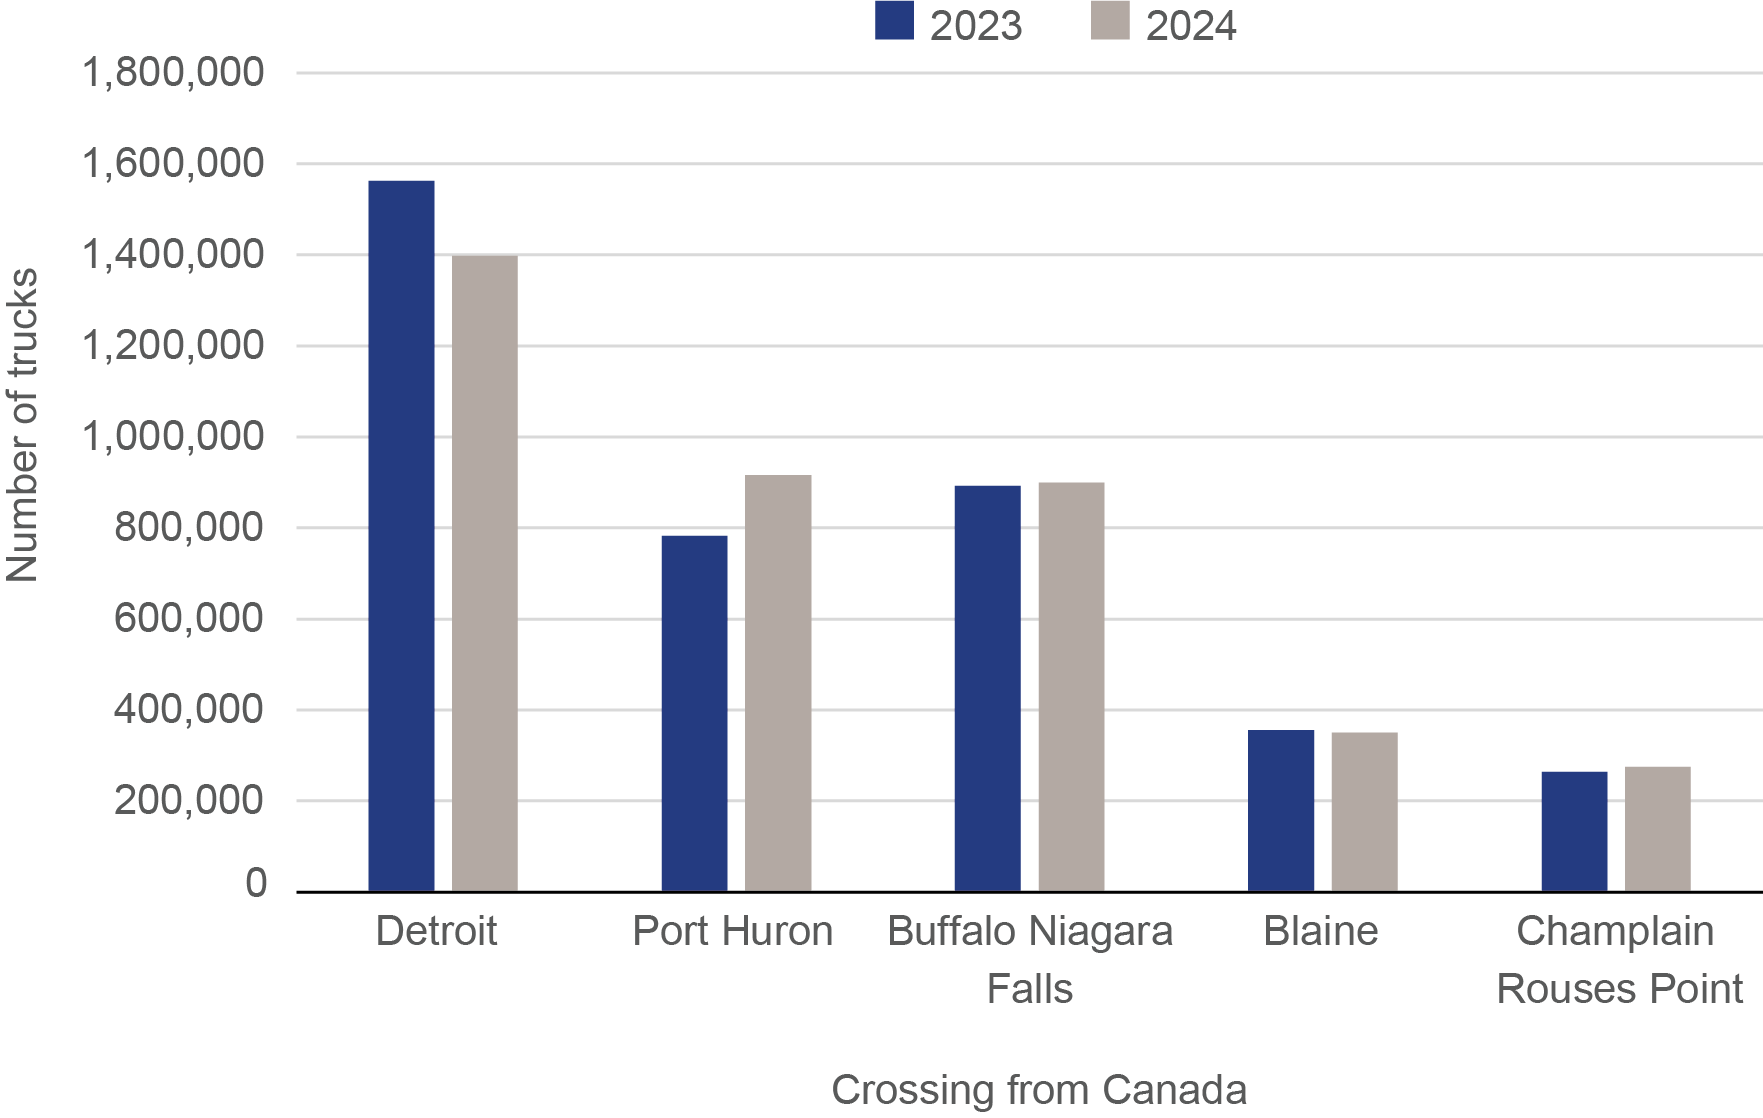
In 2024, the total number of trucks entering the U.S. from Canada in the top 5 ports decreased 0.5 from 2023. The port of Detroit, Michigan had 1,397,872 incoming trucks and handled 36.4% of the total volume along the Northern border.
Figure 2. Incoming Trucks from Canada: 2023-2024
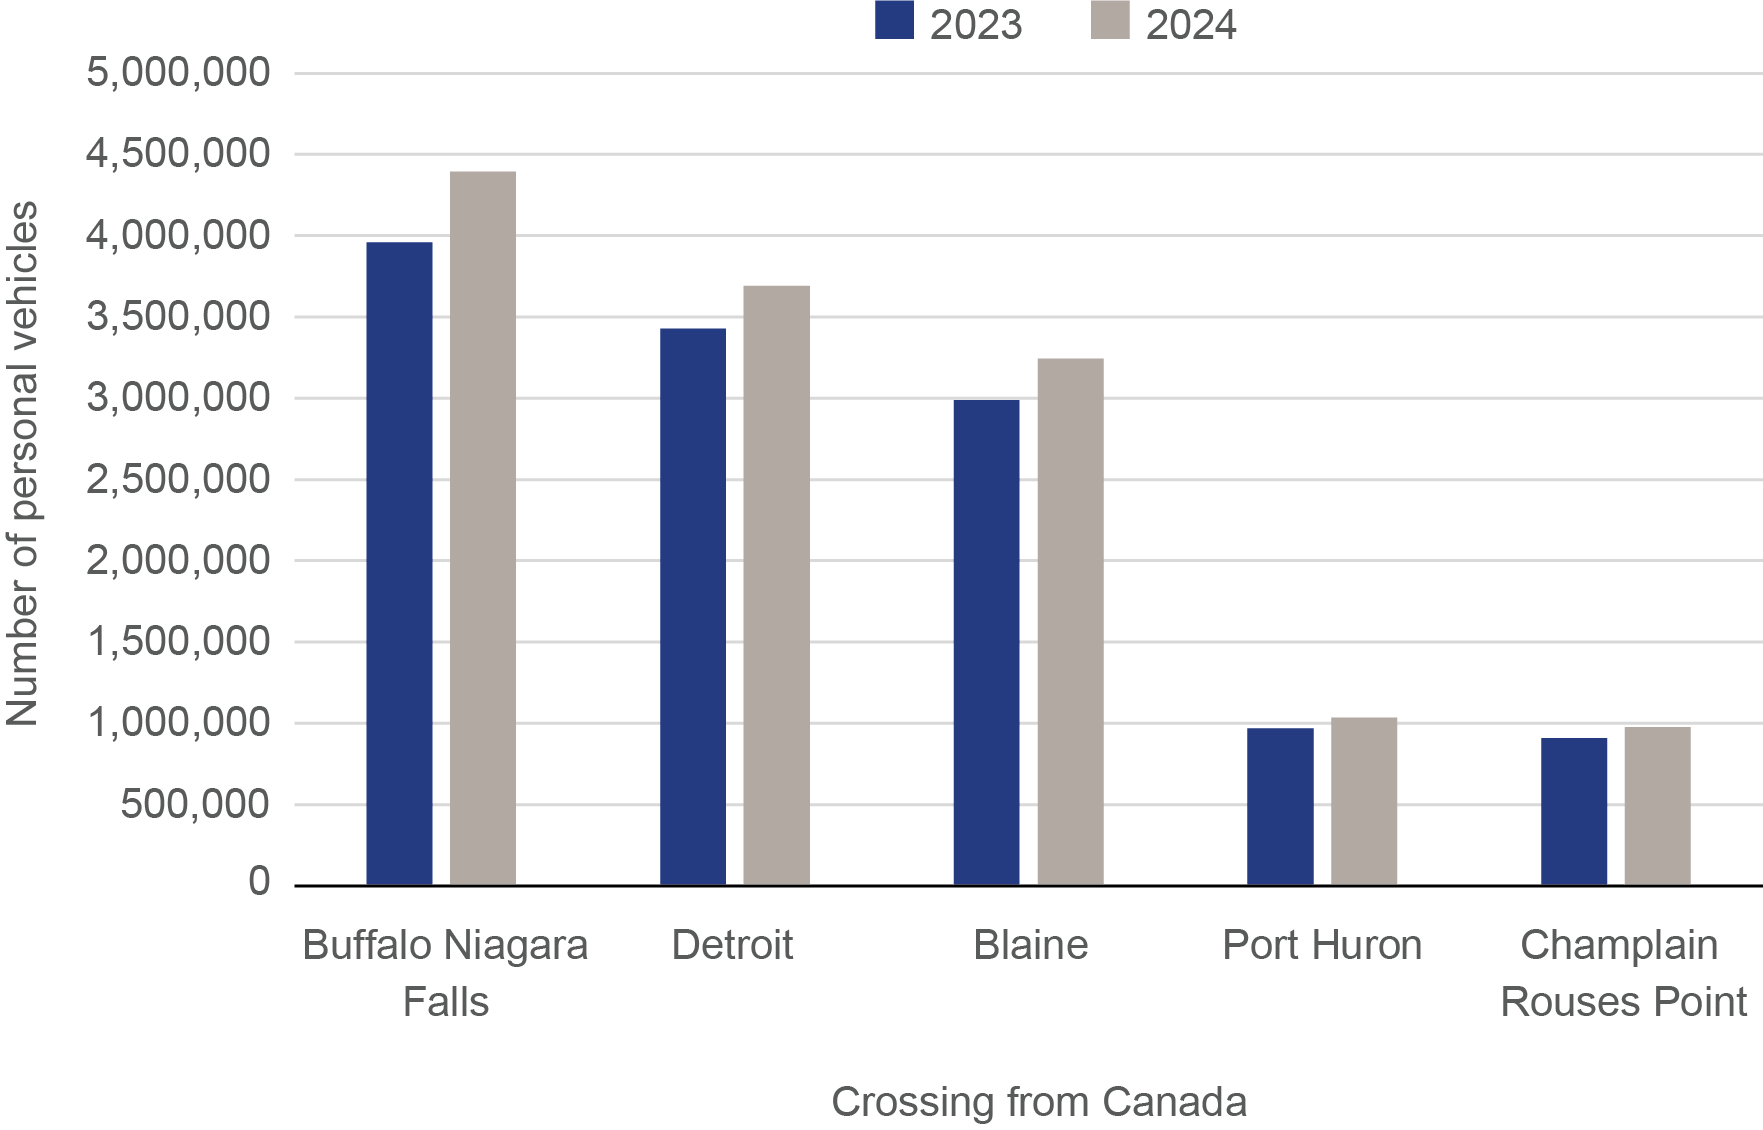
The bridges at Buffalo, New York accommodated 4,395,496 incoming personal vehicles from Canada in 2024, an 11.1% increase from 2023.
Table 3: Incoming Personal Vehicles from Canada: 2023-2024
Figure 3. Incoming Personal Vehicles from Canada: 2023-2024
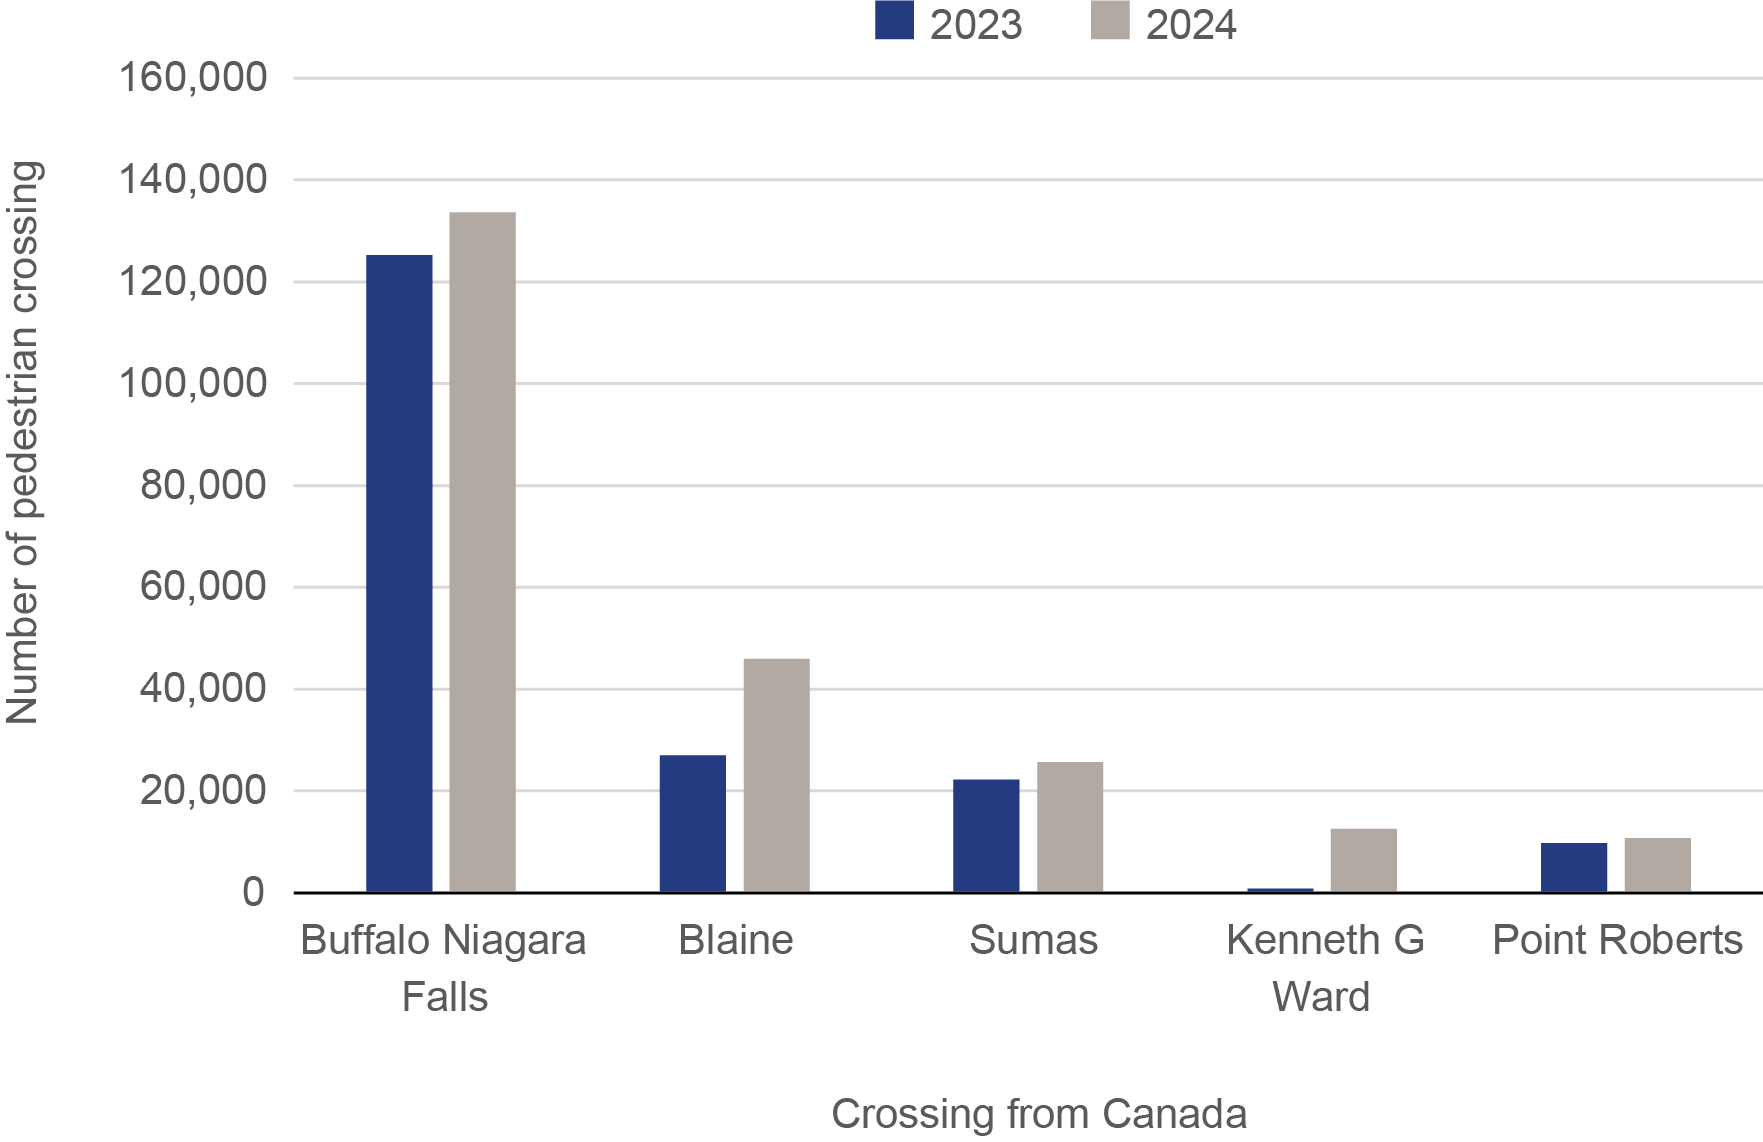
The number of pedestrians entering the U.S. from Canada at the top 5 ports increased 23.6% in 2024 from 2023. Buffalo Niagara Falls handled 58.5% of the total volume, and the number of crossings increased 6.8% year-over-year.
Figure 4. Incoming Pedestrians from Canada: 2023-2024
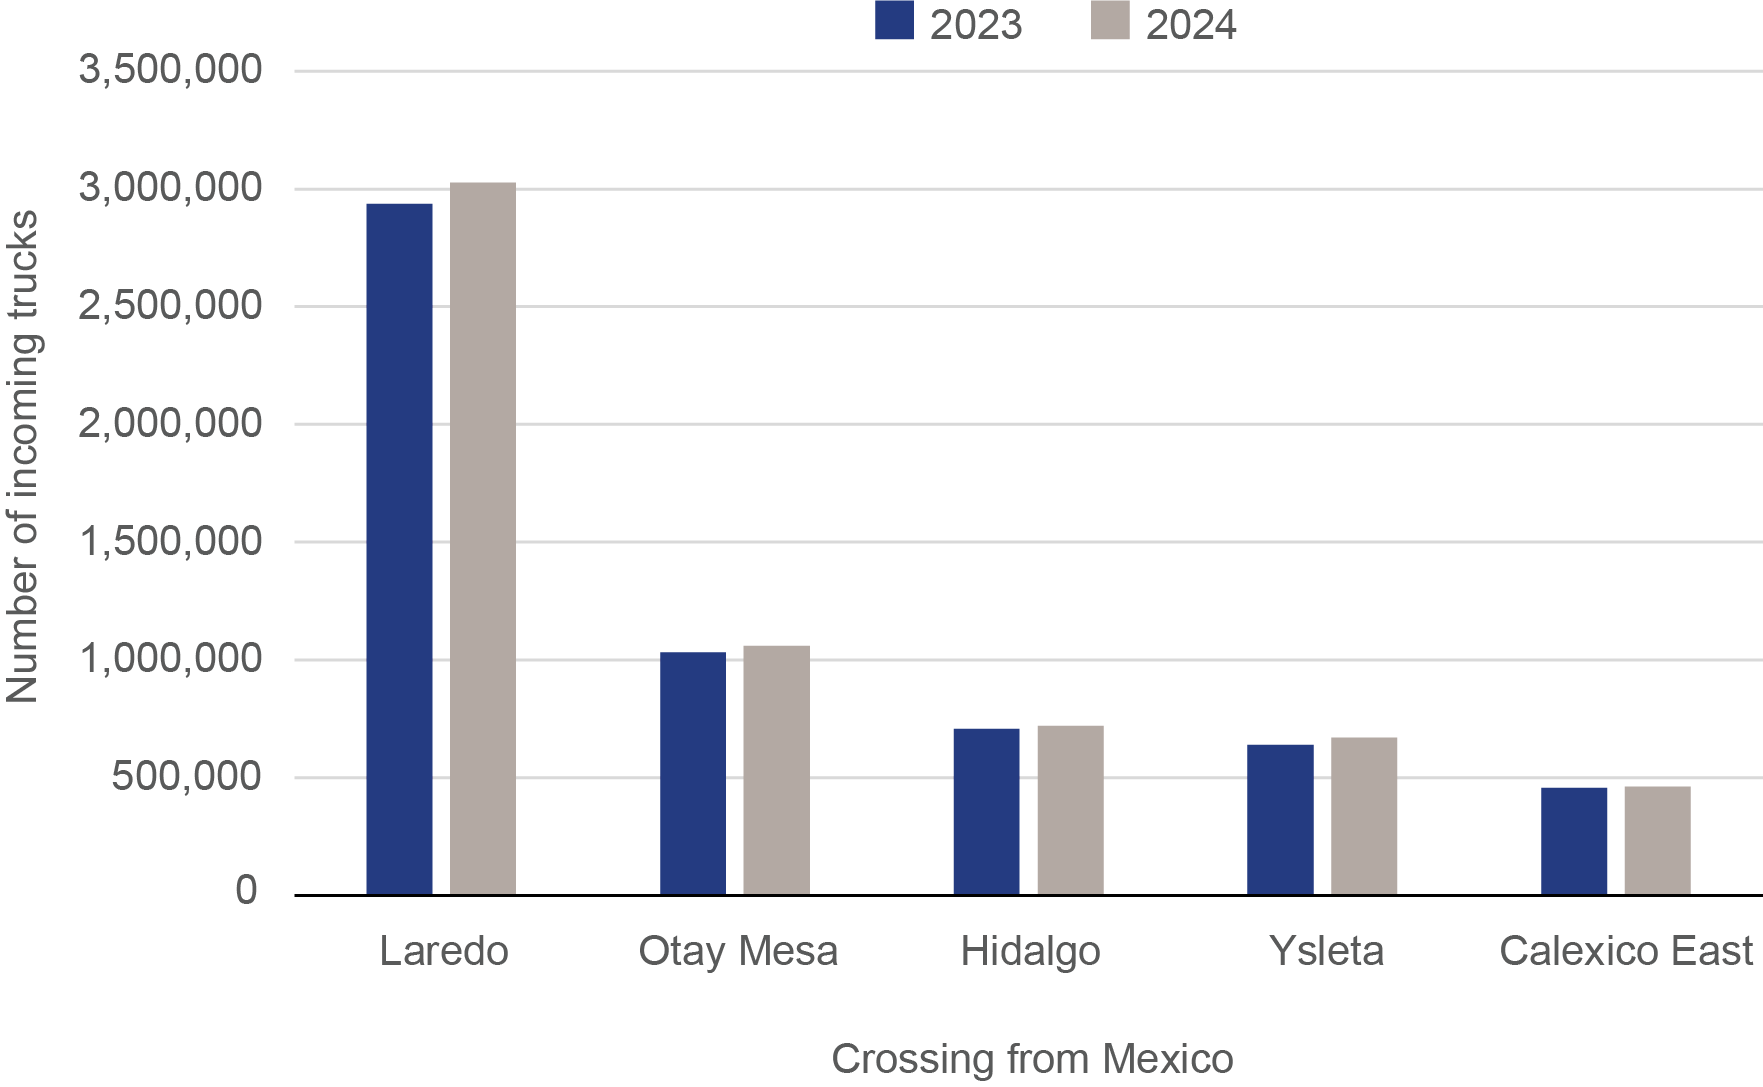
The port of Laredo, Texas handled more than 3 million incoming trucks from Mexico in 2024, a 3.1% increase from 2023. Laredo also managed half of the truck volume on the Southern border.
Figure 5. Incoming Trucks from Mexico: 2023-2024
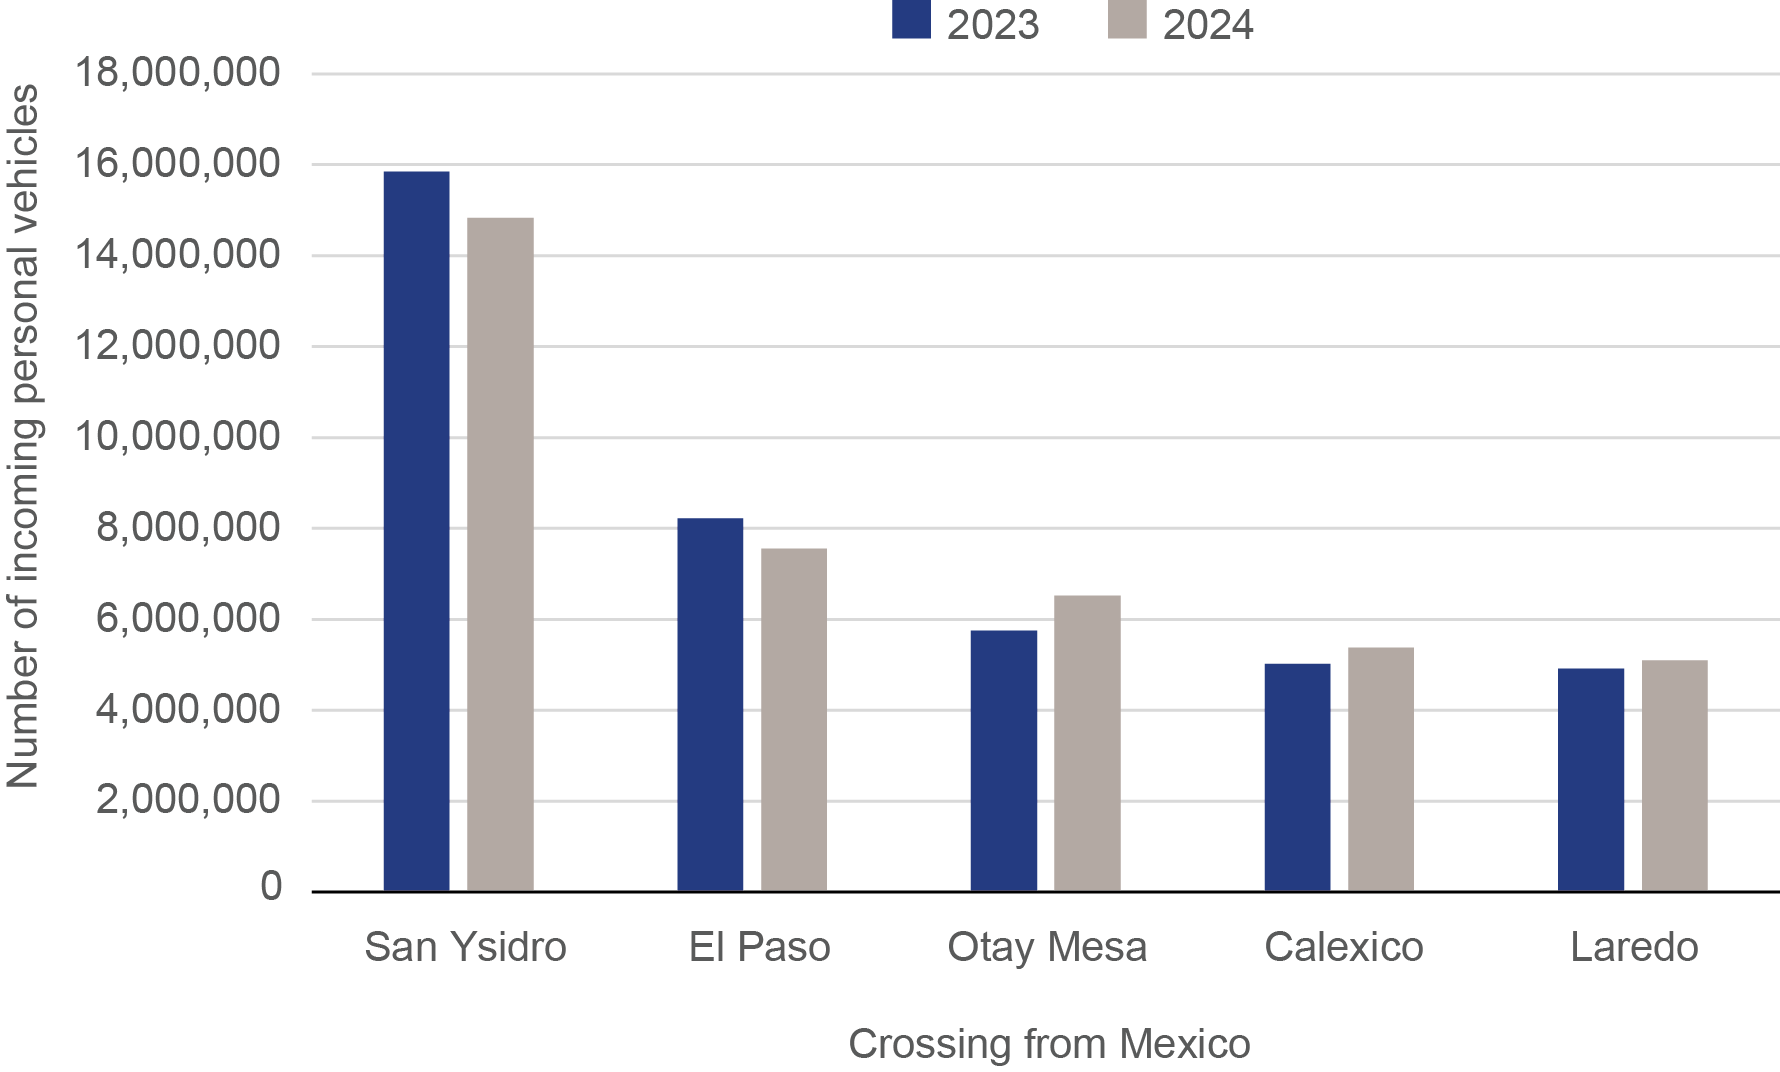
The border crossing at San Ysidro, California handled 14,829,472 cars entering the U.S. from Mexico in 2024, a 6.4% decrease from 2023.
Figure 6. Incoming Personal Vehicle from Mexico: 2023-2024
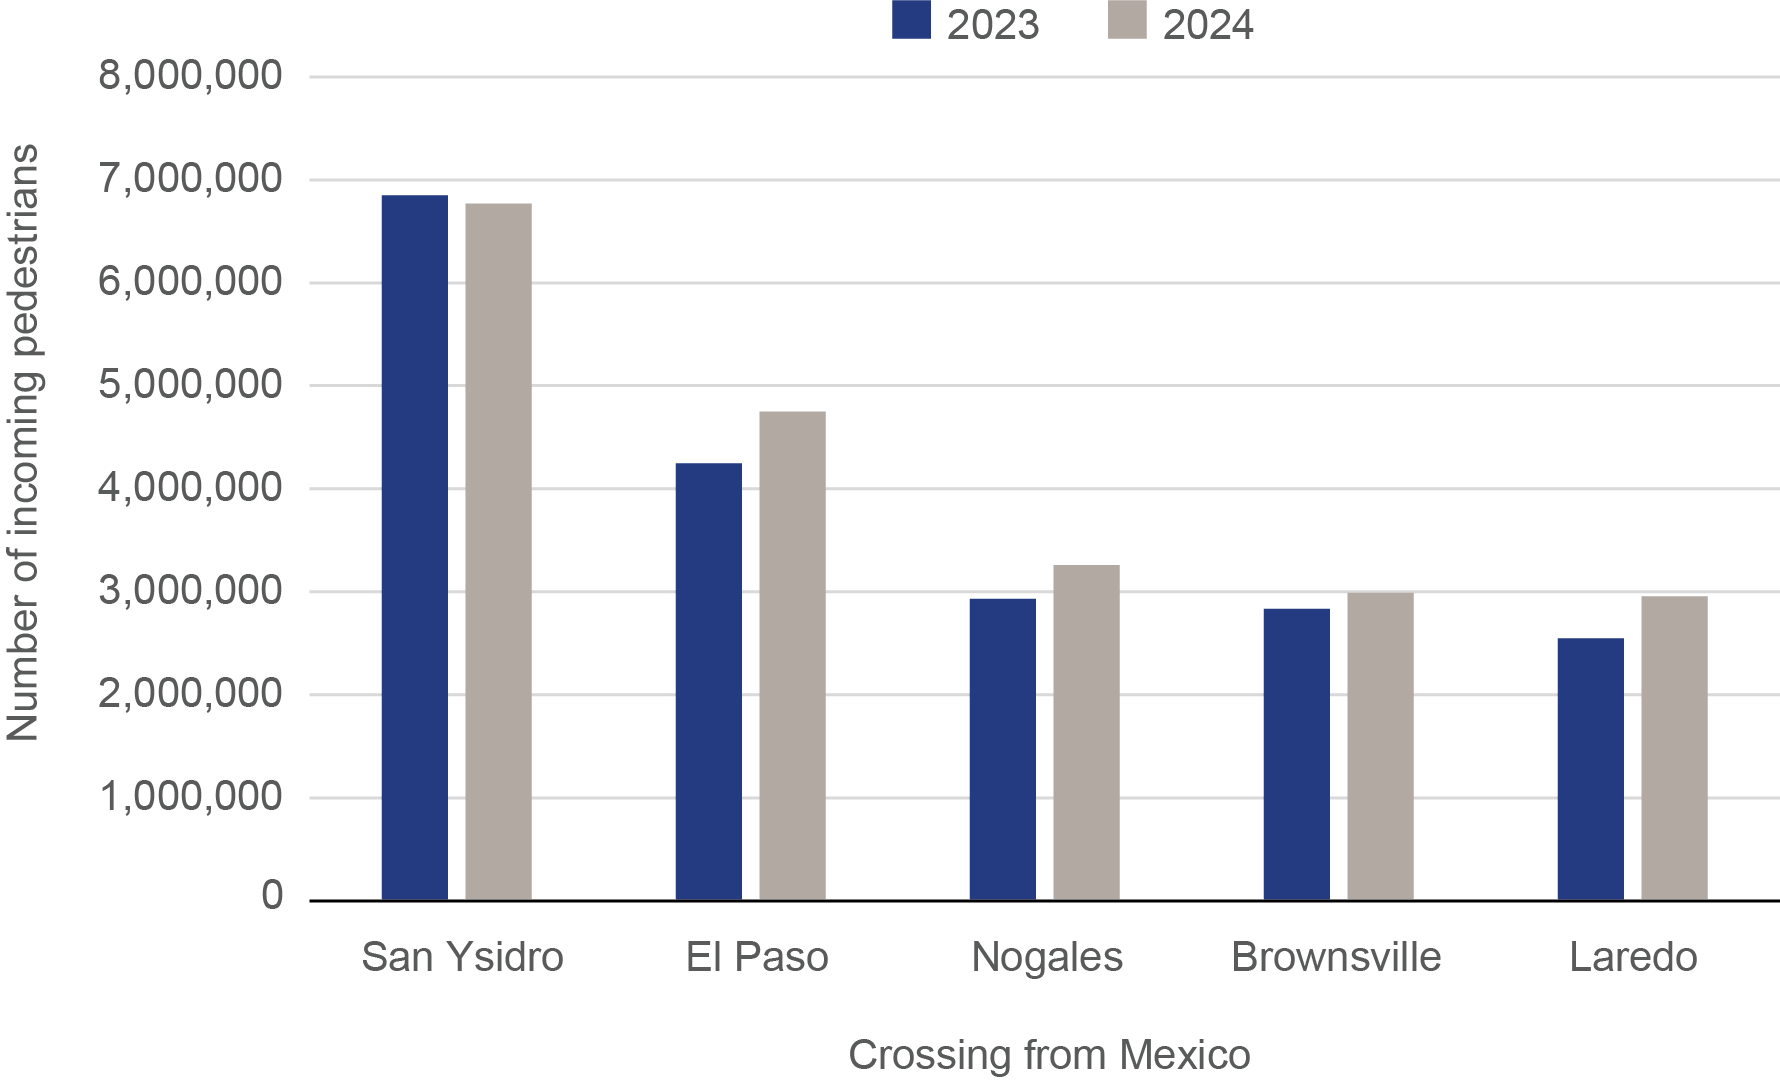
San Ysidro also accommodated 32.7% of incoming pedestrian crossings from Mexico in 2024, a 1.2% decrease from 2023. Crossings at Laredo, Texas increased 15.8% year over year.
Figure 7. Incoming Pedestrians from Mexico: 2023-2024
To receive updates from BTS directly to your email, please consider subscribing to our GovDelivery service.
| ||||||||||||||||||||||||||||||||||||||||||||||||||||||||||||||||||||||||||||||||||||||||||||||||||||||||||||||||||||||||||||||||||||||||||||||||||||||||||||||||||||||||||||||||||||||||||||||||||||||||||||||||||||||||||||||||||||||||||||||||||||||||||||


0 Komentar untuk "Border Crossing Data Annual Release: 2023 - 2024"