| North American Transborder Freight rose 5.6% in July 2024 from July 2023 Wednesday, September 18, 2024 BTS 44-24 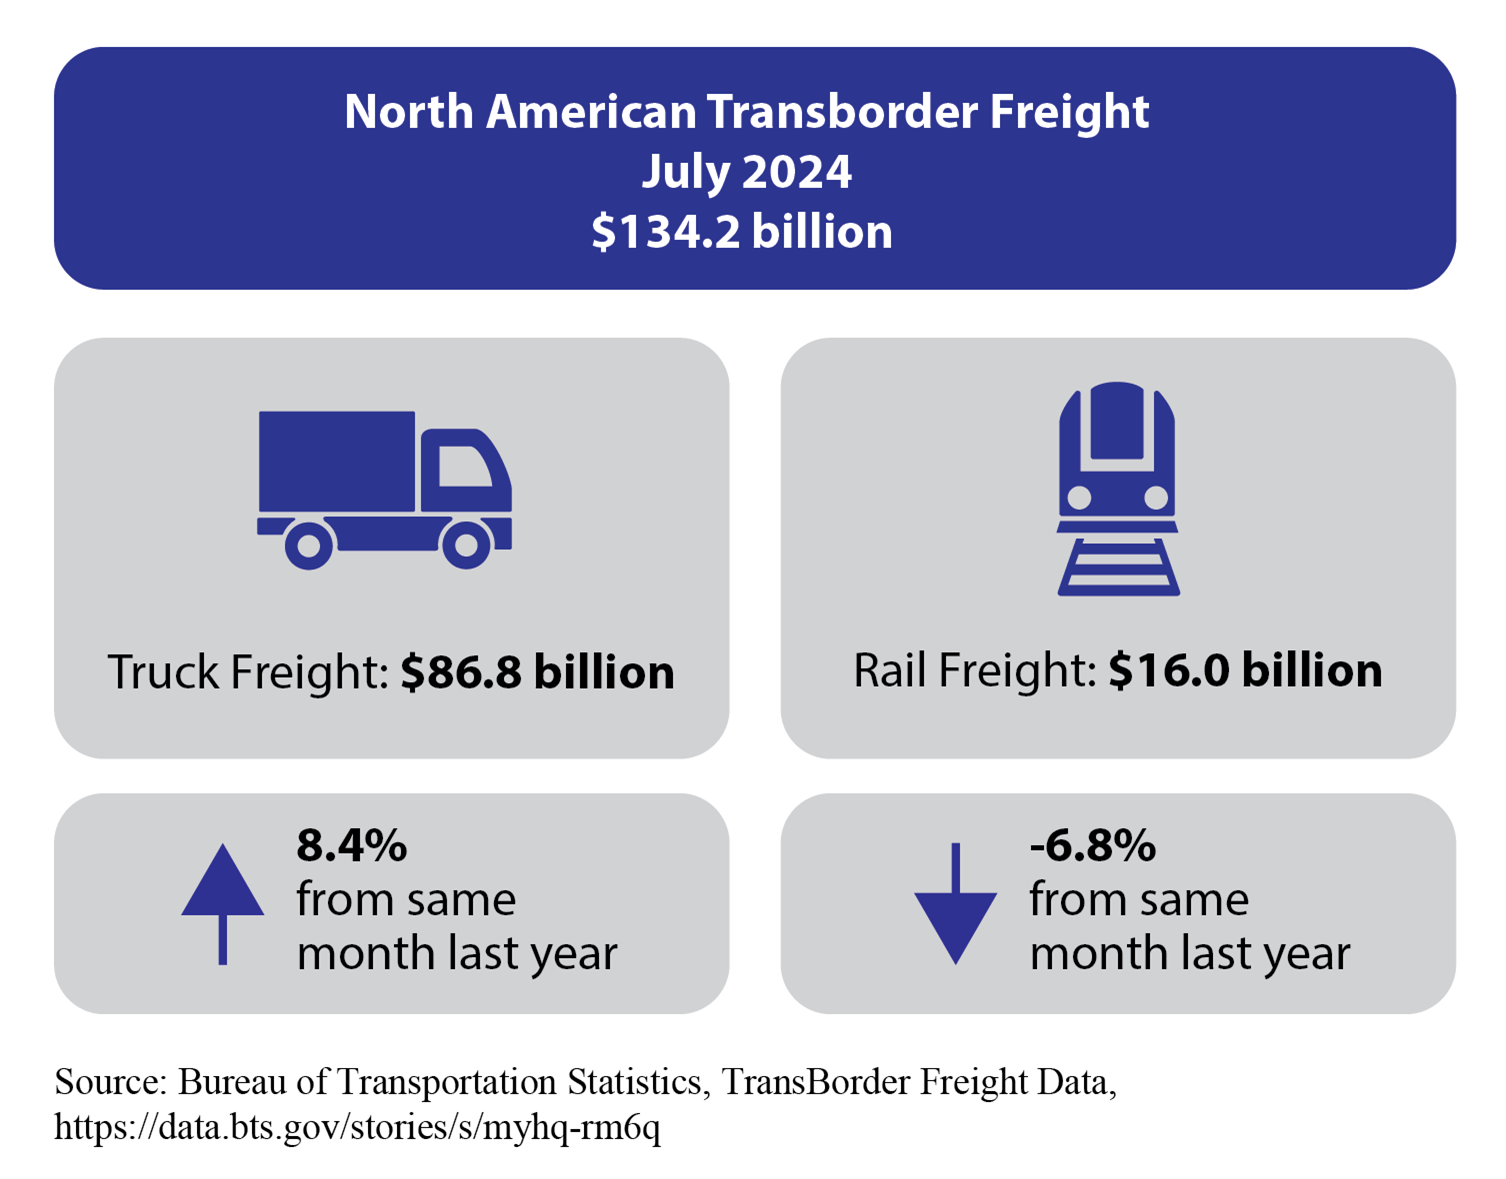
The statistics in this release do not reflect changes in tonnage moved. Total Transborder Freight by Border in July 2024, Compared to July 2023:
Transborder freight between the U.S. and North American countries Canada and Mexico: - Total transborder freight: $134.2 billion of transborder freight moved by all modes of transportation, up 5.6% compared to July 2023
- Freight between the U.S. and Canada: $63.5 billion, up 2.8% from July 2023
- Freight between the U.S. and Mexico: $70.7 billion, up 8.2% from July 2023
- Mexico continued to lead Canada in freight dollar value for the last 17 months
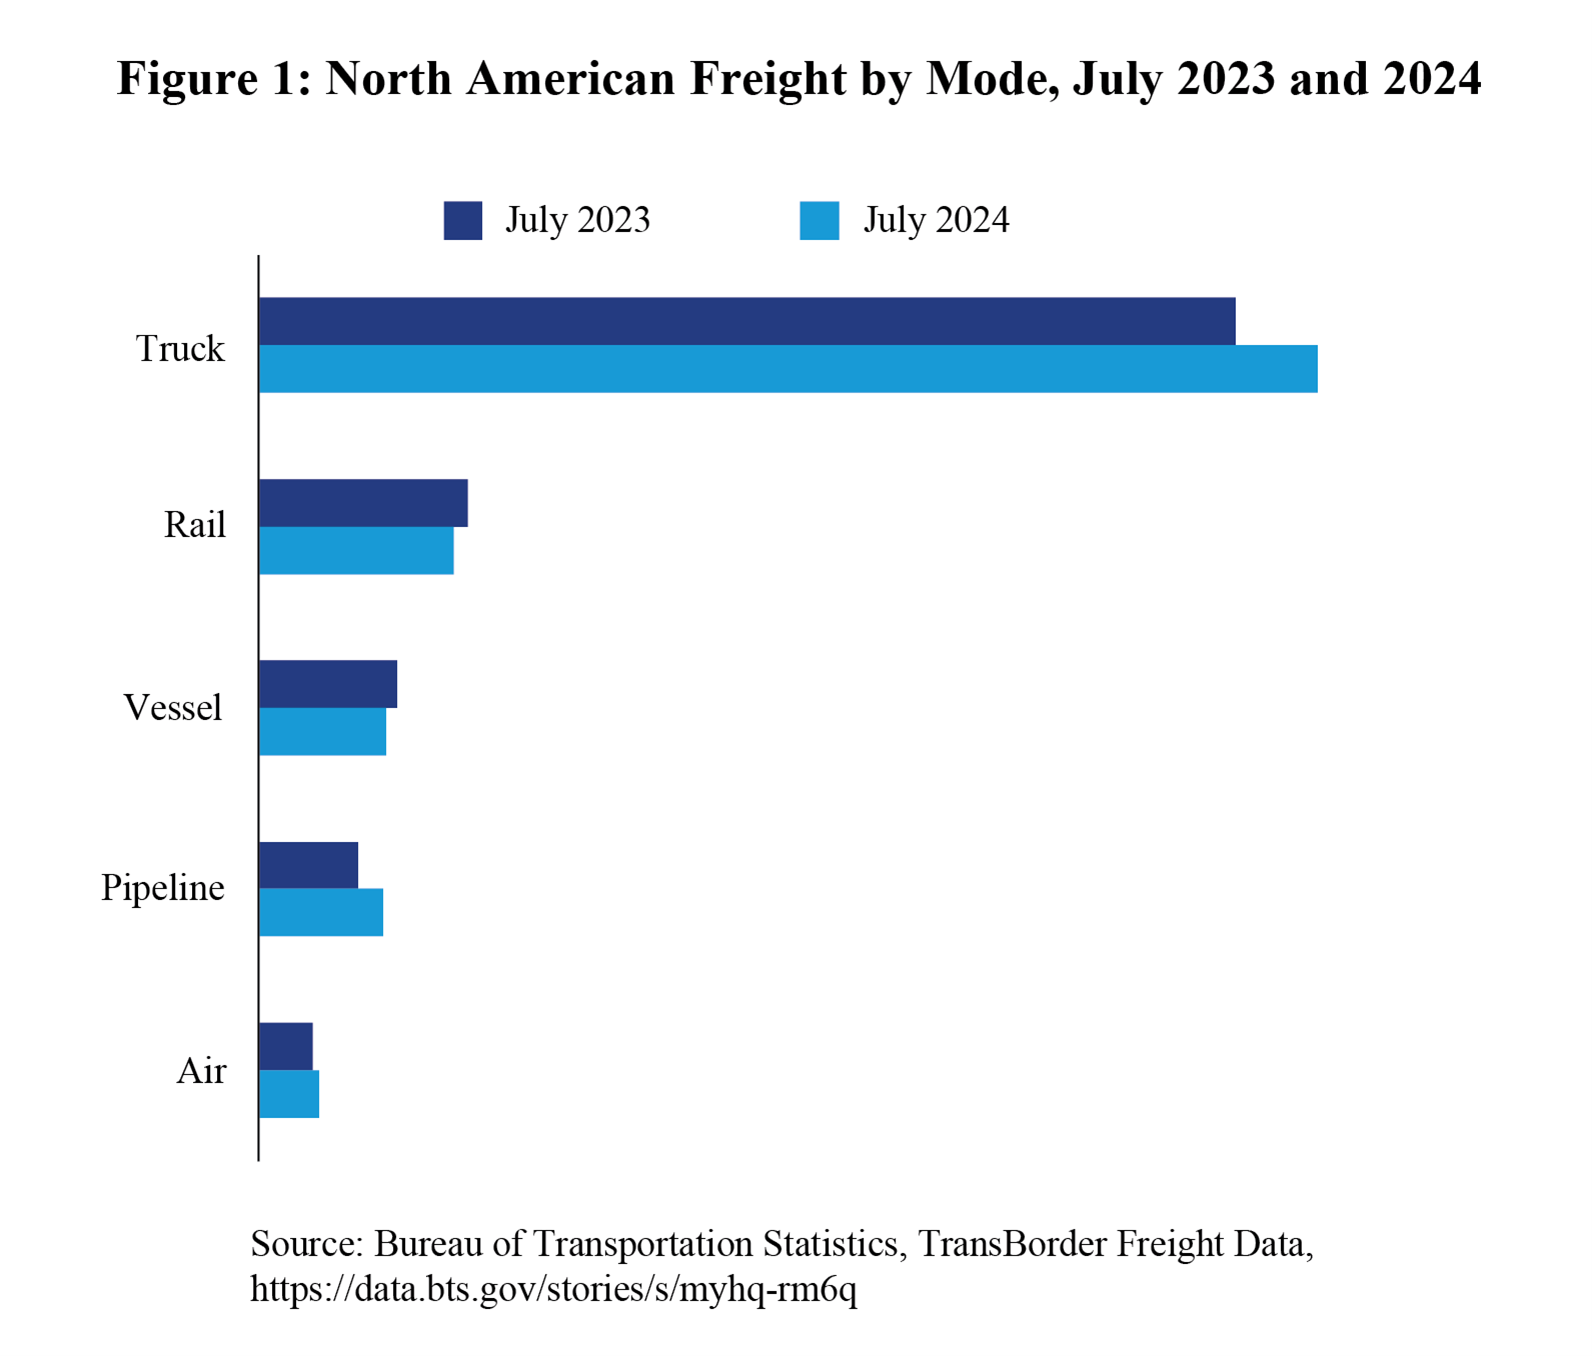
- Trucks moved $86.8 billion of freight, up 8.4% compared to July 2023
- Railways moved $16.0 billion of freight, down 6.8% compared to July 2023
- Vessels moved $10.5 billion of freight, down 8.1% compared to July 2023
- Vessels moved 13.2% less mineral fuels
- Pipelines moved $10.2 billion of freight, up 25.1% compared to July 2023
- Pipelines carried 25.1% more mineral fuels (87.2% imports)
- Air moved $5.0 billion of freight, up 12.3% compared to July 2023
Total Transborder Freight by Border and Mode: U.S.-Canada (both directions)
(Dollars in Billions) | U.S.-Mexico (both directions)
(Dollars in Billions) | | Truck | $35.4 | Truck | $51.5 | | Pipeline | $9.6 | Rail | $8.0 | | Rail | $8.0 | Vessel | $6.7 | | Vessel | $3.8 | Air | $1.8 | | Air | $3.2 | Pipeline | $0.6 | Detroit, Port Huron, and Buffalo are the top truck ports for U.S. freight flows with Canada, while Laredo, El Paso, and Otay Mesa are the top truck ports with Mexico. Detroit, Port Huron, and International Falls are the top rail connection ports for U.S. freight flows with Canada, while Laredo, Eagle Pass, and El Paso are the top rail connection ports with Mexico. Chicago, Port Huron, and Minneapolis are the top pipeline connection regions for U.S. energy freight flows with Canada. El Paso, Hidalgo, and Laredo are the top pipeline connection regions with Mexico. Port of Boston, Arthur, and Portland are the top water port connections for U.S. energy flows with Canada. Port of Houston, Arthur, and Texas City are the top water port connections for U.S. energy flows on the Southern border. 
Source: U.S. Energy Information Administration U.S. – Canada and Mexico Freight Breakdown | U.S.-Canada | U.S.-Mexico | | Top three truck ports | Top three truck ports | | Detroit, MI | $9.0 billion | Laredo, TX | $23.8 billion | | Port Huron, MI | $6.7 billion | El Paso-Ysleta, TX | $7.4 billion | | Buffalo, NY | $6.1 billion | Otay Mesa, CA | $5.1 billion | | Top three truck commodities | Top three truck commodities | Computers/parts
| $5.6 billion | Computers/parts | $12.3 billion | | Vehicles/parts | $4.3 billion | Electrical machinery | $11.0 billion | | Electrical machinery | $2.4 billion | Vehicles/parts | $7.3 billion | | Top three rail ports | Top three rail ports | | Detroit, MI | $2.1 billion | Laredo, TX | $3.7 billion | | Port Huron, MI | $1.7 billion | Eagle Pass, TX | $2.8 billion | | Buffalo, NY | $1.0 billion | Nogales, AZ | $0.6 billion | | Top three rail commodities | Top three rail commodities | | Vehicles/parts | $2.6 billion | Vehicles/parts | $3.9 billion | | Mineral fuel | $0.7 billion | Beverages/spirits | $0.6 billion | | Plastics | $0.6 billion | Computers/parts | $0.6 billion | Reporting Notes All monetary values are in current US dollars and are not adjusted for inflation or seasonality. For previous statistical releases and summary tables, see transborder releases. See transborder freight data for data from previous months, and additional state, port, and commodity data. BTS has scheduled the next release of transborder numbers for Wednesday, October 23, 2024.
| U.S. Department of Transportation | 1200 New Jersey Avenue, SE | Washington DC 20590 | 855-368-4200 |  | |


0 Komentar untuk "North American Transborder Freight rose 5.6% in July 2024 from July 2023"