
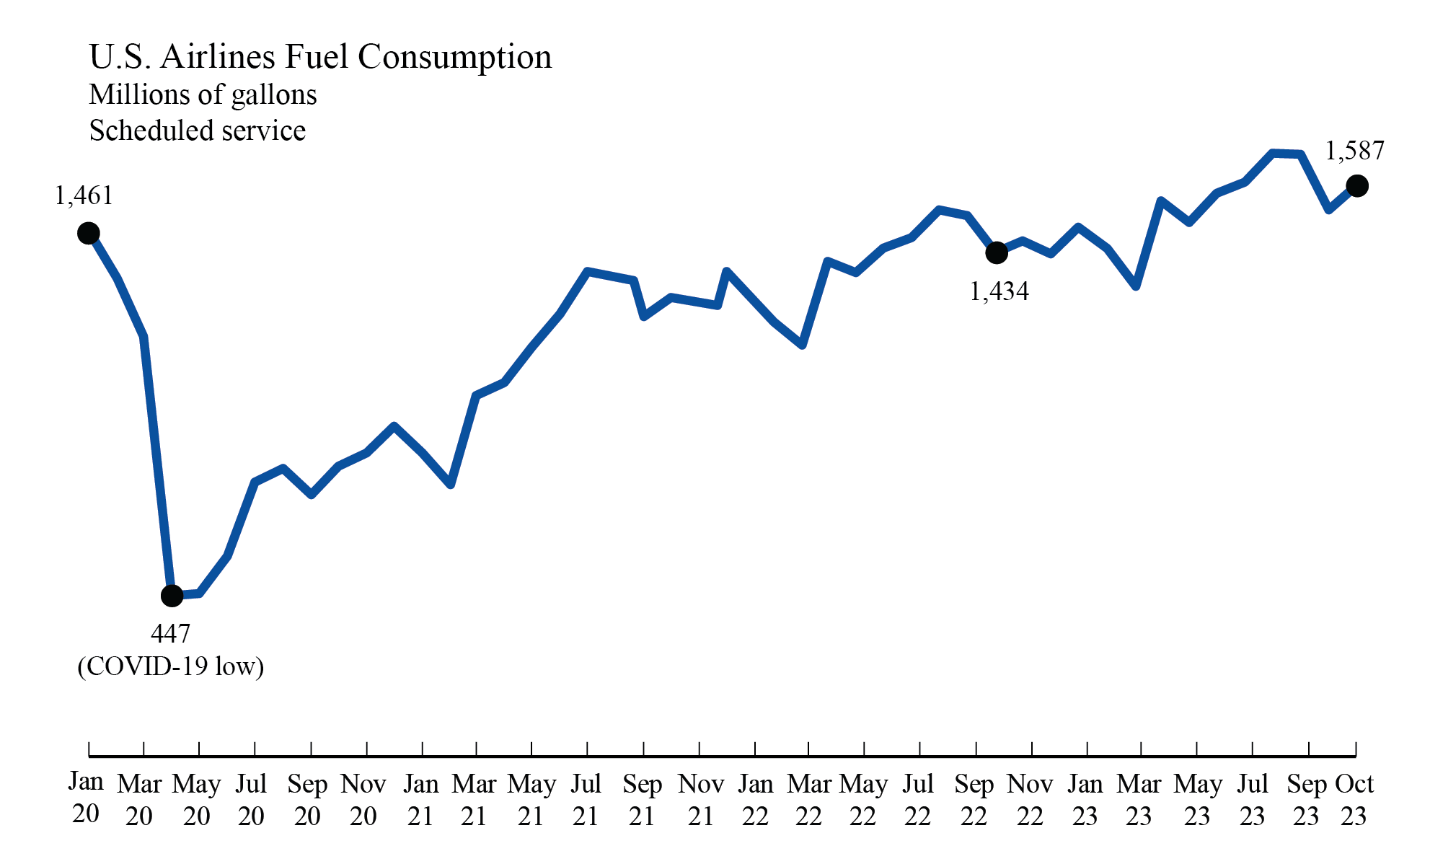
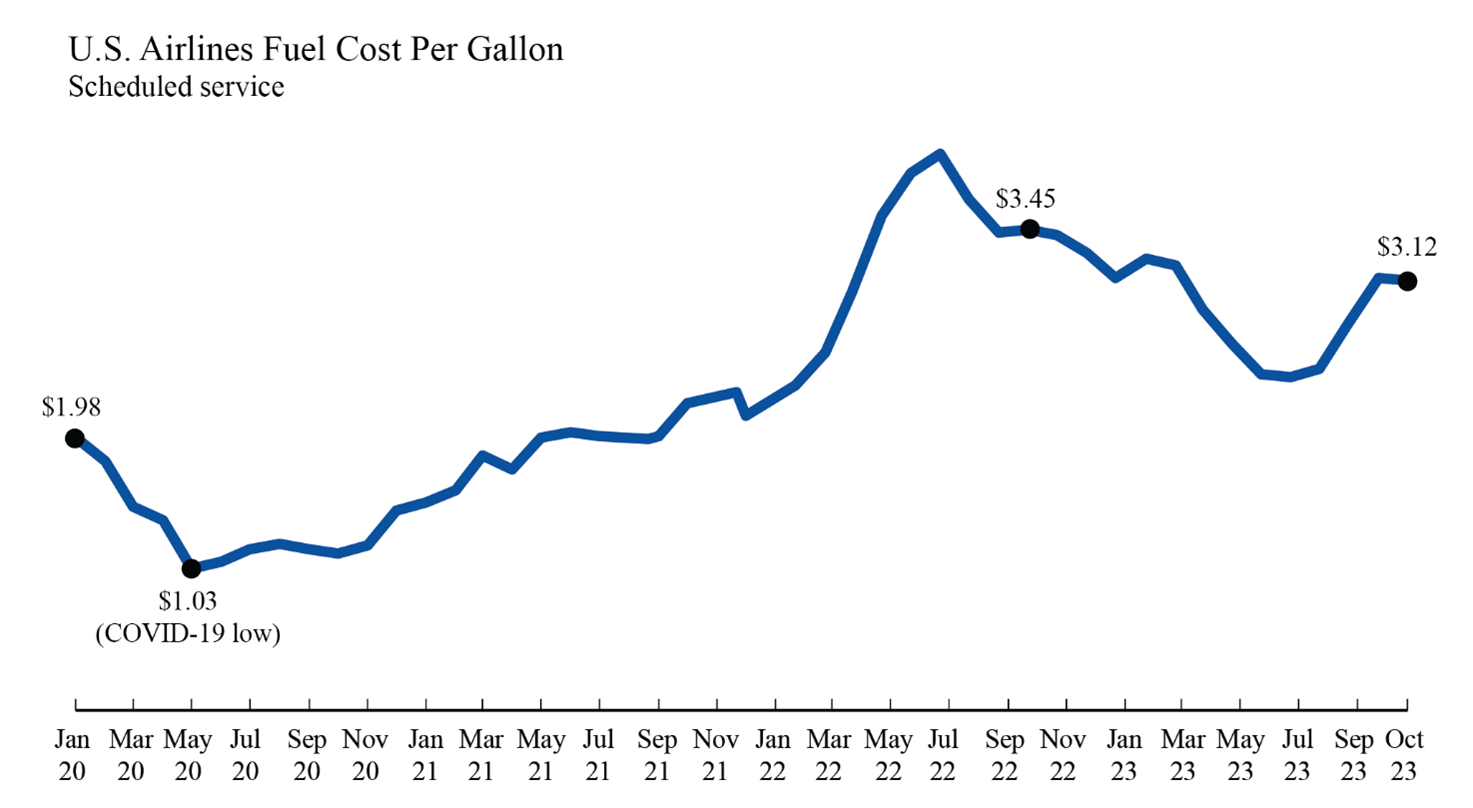
U.S. Airlines' October 2023 Fuel Cost per Gallon Down 0.8% from September 2023; Aviation Fuel Consumption Up 2.9% from Pre-Pandemic October 2019Monday, December 4, 2023 The Department of Transportation's Bureau of Transportation Statistics (BTS) today released U.S. airlines' October 2023 fuel cost and consumption numbers indicating U.S. scheduled service airlines used 1.587 billion gallons of fuel, 4.5% more fuel than in September 2023 (1.519 billion gallons) and 2.9% more than in pre-pandemic October 2019. The cost per gallon of fuel in October 2023 ($3.12) was down 2.6 cents (0.8%) from September 2023 ($3.14) and up $1.15 (58.3%) from October 2019. Total October 2023 fuel expenditure ($4.95B) was up 3.6% from September 2023 ($4.78B) and up 63.0% from pre-pandemic October 2019. Year-over-year changes in fuel consumption and cost for October 2023 include 9.3% increase in domestic fuel consumption, 2.1% decrease in domestic fuel cost, and 10.4% decrease in cost per gallon. Domestic fuel consumption increased 6.6% from September 2023 to October 2023, while increasing 3.7% from October 2019. Increased fuel consumption reflects an increase in airline passenger travel over the same period.
Fuel consumed by U.S. airlines (total) scheduled service:
Fuel Cost and Consumption data from January 2000 to the present can be found at https://transtats.bts.gov/fuel.asp. Summaries by month are also available. Airline fuel costs may be affected by hedging, contracts that allow airlines to limit exposure to future price changes. None of the cost numbers are adjusted for inflation. The month-to-month numbers are not seasonally adjusted. Individual airline numbers through June 2023 are available on the BTS website. Please Note: ###
| ||||||||||||||||||||||||||||||||||||||||||
Beranda » Tanpa Label » U.S. Airlines’ October 2023 Fuel Cost per Gallon Down 0.8% from September 2023; Aviation Fuel Consumption Up 2.9% from Pre-Pandemic October 2019


0 Komentar untuk "U.S. Airlines’ October 2023 Fuel Cost per Gallon Down 0.8% from September 2023; Aviation Fuel Consumption Up 2.9% from Pre-Pandemic October 2019"