| Friday, February 20, 2026 BTS 26-20 The Bureau of Transportation Statistics (BTS) Border Crossing data program provides comprehensive summary data for inbound crossings at the U.S.-Canada and U.S.-Mexico borders. Reported at the port level, these statistics cover various modes of transport, including trucks, trains, containers, buses, and personal vehicles, as well as passenger and pedestrian counts. This data is collected by U.S. Customs and Border Protection (CBP) at official land border crossing stations and transmitted to BTS monthly. Because CBP focuses exclusively on arrivals, comparable federal data for outbound crossings is not available. Researchers requiring outbound traffic figures should consult alternative sources, such as individual bridge operators, border state agencies, or official reports from the governments of Mexico and Canada. Detailed datasets and further information can be accessed directly through on the Border Crossing Data page. Overview Personal vehicles are the primary mode of transportation for entering the U.S. by land, with 94.4 million crossings in 2025. While this figure reflects a 5.1% decline from 2024, it also remains 5.4% below the 2019 pre-pandemic peak. In contrast, pedestrian traffic showed steady growth in 2025, increasing by 9.9% year-over-year to 45.1 million, primarily comprising of crossings from Mexico, with 44.8 million entries. Commercial truck traffic saw a slight 2.4% dip in 2025 compared to the previous year. Truck crossings is the only major mode that has grown since 2019, a 6.1% increase from pre-pandemic levels. Geographically, Mexico accounts for the larger share of land border crossings. On the southern border, Laredo serves as the main gateway for Mexican trade, with 38.8% of truck traffic. On the northern border, Detroit is the top port for Canadian freight with 21.5% of the truck traffic. Crossings by bus are the most severely impacted mode, down 35.2% from 2019 and 19.1% year-over-year, suggesting a structural shift in group travel.
Inbound U.S. Land Border Crossings: 2019 – 2023 | Mode | 2019 | 2020 | 2021 | 2022 | 2023 | | Personal Vehicle | 99,818,117 | 56,833,417 | 62,978,835 | 87,509,943 | 96,499,996 | | Pedestrians | 49,698,880 | 25,046,046 | 27,972,129 | 36,071,311 | 39,637.634 | | Trucks | 12,121,410 | 11,580,717 | 12,519,086 | 12,751,628 | 12,882,715 | | Buses | 228,070 | 99,122 | 99,647 | 110,402 | 167,053 | Inbound U.S. Land Border Crossings: 2024 – 2025 | Mode | 2024 | 2025 | 2019-2025 % Change | 2024-2025 % Change | | Personal Vehicle | 99,448,048 | 94,385,166 | -5.4 | -5.1 | | Pedestrians | 41,036,476 | 45,103,300 | -9.2 | 9.9 | | Trucks | 13,167,757 | 12,856,744 | 6.1 | -2,4 | | Buses | 182,876 | 147,868 | -35.2 | -19.1 | 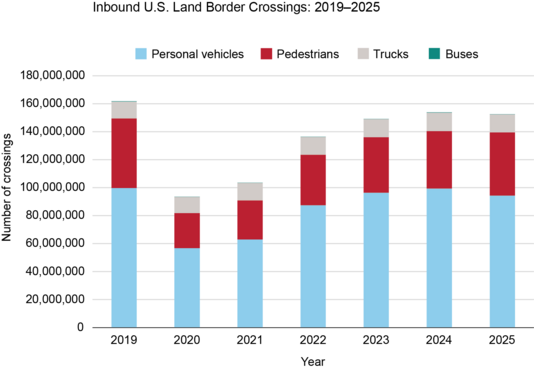 Northern border key points - Personal vehicle crossings from Canada decreased 18.8% in 2025 (18.3 million) compared to 2024 (22.6 million). The port of Blaine experienced the steepest drop, falling by approximately 25 percent.
- Truck traffic on the Northern border declined by 5.1% from 2024. Port Huron had a 15.8% increase in volume while Detroit experienced a 19% decrease. Commercial carriers often shift from the urban center of Detroit to the Blue Water Bridge in Port Huron due to construction near the I-75/I-96 interchange.
- Buffalo Niagara Falls is the busiest gateway for both personal vehicles (20.1%) and pedestrians (66.7%) on the Northern border.
- In May 2025, the Niagara Falls Bridge Commission implemented a toll hike for passenger and commercial vehicles at the Rainbow, Whirlpool-Rapids, and Lewiston-Queenston bri
Trucks from Canada: 2023-2025 | Top 5 ports | 2023 | 2024 | 2025 | YoY Change | Port % of Total | | Detroit | 1,562,531 | 1,397,872 | 1,132,114 | -19.0 | 21.5 | | Port Huron | 782,260 | 916,222 | 1,060,776 | 15.8 | 20.1 | | Buffalo Niagara Falls | 892,838 | 898,786 | 865,370 | -3.7 | 16.4 | | Blaine | 356,021 | 350,306 | 330,536 | -5.6 | 6.3 | | Champlain Rouses Point | 263,689 | 274,214 | 269,604 | -1.7 | 5.1 | | Total all ports | 5,526,056 | 5,550,550 | 5,267,429 | -5.1 | 100.0 | 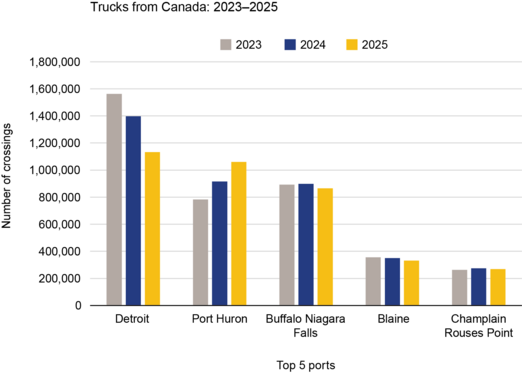 Personal Vehicles from Canada: 2023-2025 | Top 5 ports | 2023 | 2024 | 2025 | YoY Change | Port % of Total | | Buffalo Niagara Falls | 3,957.668 | 4,395,496 | 3,678,378 | -16.3 | 20.1 | | Detroit | 3,425,680 | 3,691,743 | 3,462,294 | -6.2 | 18.9 | | Blaine | 2,989,575 | 3,243,799 | 2,433,220 | -25.0 | 13.3 | | Port Huron | 968,198 | 1,035,757 | 822,138 | -20.6 | 4.5 | | Massena | 821,708 | 862,019 | 808,407 | -6.2 | 4.4 | | Total all ports | 20,608,230 | 22,563,482 | 18,328,958 | -18.8 | 100.0 | 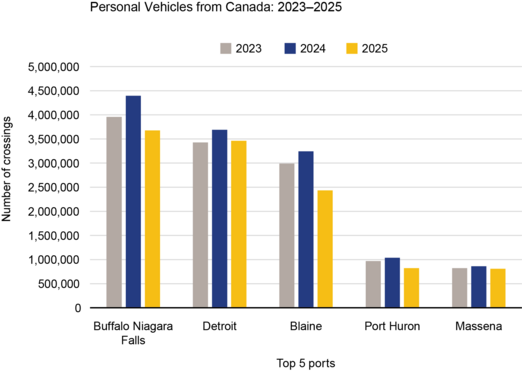 Pedestrians from Canada: 2023-2025 | Top 5 ports | 2023 | 2024 | 2025 | YoY Change | Port % of Total | | Buffalo Niagara Falls | 125,161 | 133,689 | 205,882 | 54.0 | 66.7 | | Blaine | 26.991 | 45,950 | 35,343 | -23.1 | 11.5 | | Sumas | 22,991 | 25,608 | 18,155 | -29.1 | 5.9 | | International Falls | 5,389 | 7,458 | 5,895 | -21.0 | 1.9 | | Calais | 4,214 | 6,350 | 5,724 | -9.9 | 1.9 | | Total all ports | 215,983 | 267,412 | 308,610 | -15.4 | 100.0 | 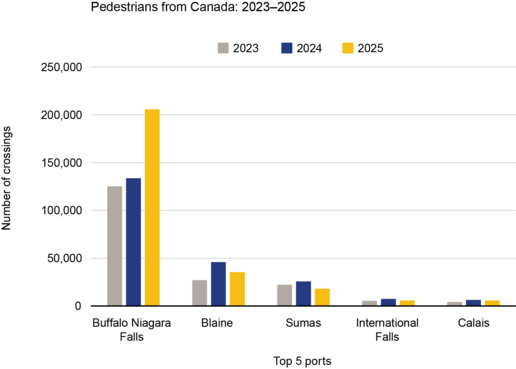 Buses from Canada: 2023-2025 | Top 5 ports | 2023 | 2024 | 2025 | YoY Change | Port % of Total | | Skagway | 12,025 | 10,060 | 11,463 | 13.9 | 26.8 | | Buffalo Niagara Falls | 8,322 | 9,813 | 7,745 | -21.1 | 18.1 | | Blaine | 6,753 | 6,833 | 6,823 | -0.1 | 15.9 | | Detroit | 7,268 | 7,962 | 5,461 | -31.4 | 12.8 | | Champlain Rouses Point | 6,372 | 6,617 | 4,362 | -34.1 | 10.2 | | Total all ports | 48,334 | 50,129 | 308,610 | -14.6 | 100.0 | 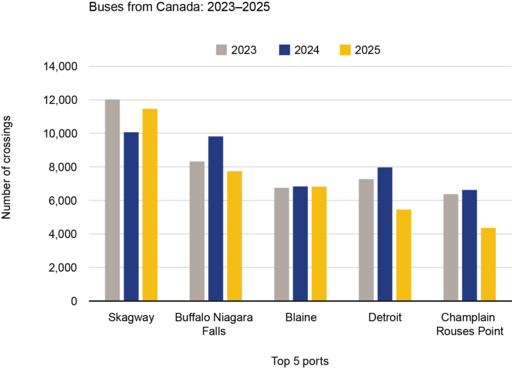 Southern border key points - The port of Laredo is the primary gateway for commercial truck traffic on the Southern land border, handling 38.8% of all inbound trucks from Mexico in 2025.
- Crossings by personal vehicles account for the largest volume among the transportation modes, with 76.1 million in 2025. Major ports like San Ysidro and El Paso had modest growth of about 3% from 2024.
- San Ysidro is the primary gateway for both personal vehicles, with a 20.1% share, and pedestrians, with a 17.8% share.
- Bus crossings fell by 20.9% in 2025. All top five ports reported double-digit declines, with Laredo seeing the most significant decrease in bus traffic at 31.7 percent.
Trucks from Mexico: 2023-2025 | Top 5 ports | 2023 | 2024 | 2025 | YoY Change | Port % of Total | | Laredo | 2,936,130 | 3,026,632 | 2,945,388 | -2.7 | 38.8 | | Otay Mesa | 1,034,188 | 1,059,759 | 990,111 | -6.6 | 13.0 | | Hidalgo | 708,726 | 721,489 | 719,184 | -0.3 | 9.5 | | Ysleta | 640,667 | 670,627 | 641,729 | -4.3 | 8.5 | | Calexico East | 458,159 | 462,526 | 446,835 | -3.4 | 5.9 | | Total all ports | 7,356,659 | 7,617,207 | 7,589,315 | -0.4 | 100.0 | 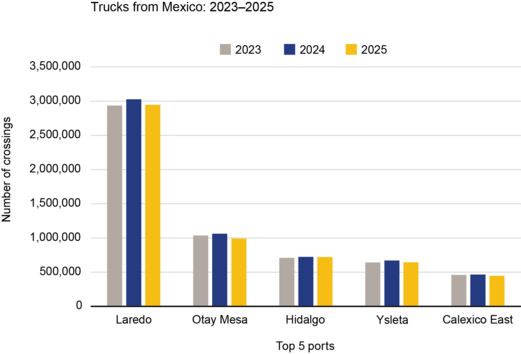 Personal Vehicles from Mexico: 2023-2025 | Top 5 ports | 2023 | 2024 | 2025 | YoY Change | Port % of Total | | San Ysidro | 15,845,661 | 14,829,472 | 15,274,409 | 3.0 | 20.1 | | El Paso | 8,221,492 | 7,544,927 | 7,784,755 | 3.2 | 10.2 | | Otay Mesa | 5,753,989 | 6,516,286 | 6,112,236 | -6.2 | 8.0 | | Calexico | 5,014,733 | 5,381,292 | 5,429,970 | 0.9 | 7.1 | | Laredo | 4,908,368 | 5,088,431 | 5,157,634 | 1.4 | 6.8 | | Total all ports | 75,891,766 | 76,844,566 | 76,056,208 | -1.1 | 100.0 | 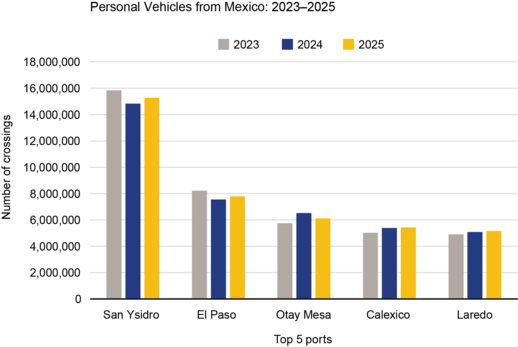 Pedestrians from Mexico: 2023-2025 | Top 5 ports | 2023 | 2024 | 2025 | YoY Change | Port % of Total | | San Ysidro | 6,847,737 | 6,766,420 | 7,968,038 | 17.8 | 17.8 | | El Paso | 4,247,771 | 4,751,776 | 5,351,995 | 12.6 | 11.9 | | Otay Mesa | 2,814,012 | 2,821,230 | 3,580,651 | 26.9 | 8.0 | | Nogales | 2,934,216 | 3,257,542 | 3,419,450 | 5.0 | 7.6 | | Calexico | 2,815,354 | 2,607,932 | 3,163,862 | 21.3 | 7.1 | | Total all ports | 39,421,651 | 40,769,064 | 44,794,690 | 9.9 | 100.0 | 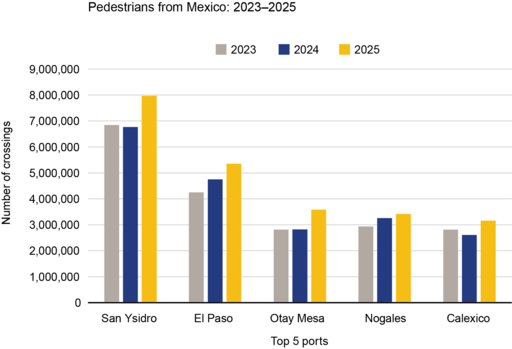 Buses from Mexico: 2023-2025 | Top 5 ports | 2023 | 2024 | 2025 | YoY Change | Port % of Total | | San Ysidro | 41,752 | 45,790 | 36,798 | -19.6 | 35.0 | | Laredo | 29,459 | 34,474 | 23,545 | -31.7 | 22.4 | | El Paso | 11,661 | 14,904 | 11,644 | -21.9 | 11.1 | | Hidalgo | 13,451 | 10,983 | 9,746 | -11.3 | 9.3 | | Nogales | 9,002 | 10.923 | 8,520 | -22.0 | 8.1 | | Total all ports | 118,719 | 132,747 | 105,059 | --20.9 | 100.0 | 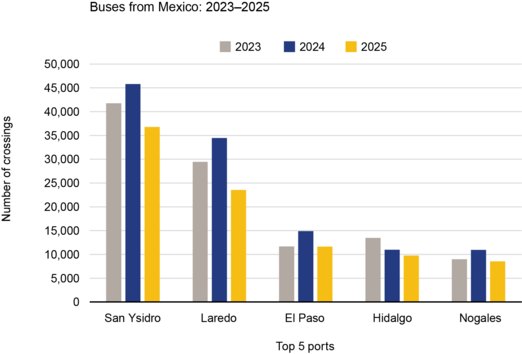 Source: Bureau of Transportation Statistics, Border Crossing/Entry Data
In 2025, land border crossing data trends show commercial truck traffic is the only sector to exceed pre-pandemic levels with a 6.1% increase despite a minor year-over-year decline. Other notable data highlights include declines in personal vehicle entries of 5.1% and bus crossings, which were down by 19.1% compared to 2024. Conversely, pedestrian traffic saw a robust 9.9% increase to 45.1 million entries. Laredo and Detroit remain the critical hubs for trade, while Buffalo Niagara Falls and San Ysidro continue to dominate passenger and pedestrian volumes.
To receive updates from BTS directly to your email, please consider subscribing to our GovDelivery service. | | | | |


0 Komentar untuk "Border Crossing Data Annual Release: 2025"