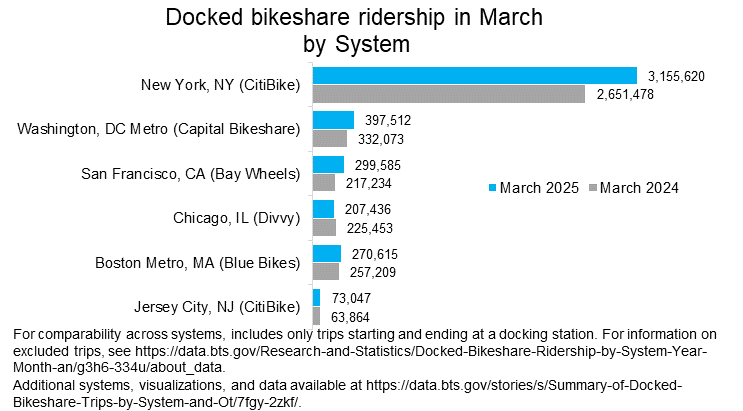
.

HD Mp4 3gp Video
Live Update Video
Play/Download
Live 3D App
Search.Pencarian Menu

Add text send email to rh3252705.adda@blogger.com or Click this (Text porn Will delete) | Tambah teks kirim email ke rh3252705.adda@blogger.com atau Klik ini (Teks porno akan dihapus)
Total pos : 19157+

Docked Bikeshare Trips – March 2025

Transportation.Gov web banner

Having trouble viewing this email? View it as a Web page.


Docked Bikeshare Trips – March 2025

Friday, April 18, 2025

Today, the Bureau of Transportation Statistics (BTS) released docked bikeshare trips for March 2025. 

From March 2024 to March 2025, docked bikeshare trips starting and ending at a docking station on six of the largest systems grew 17.5%. 


Bar chart showing Docked bikeshare ridership in March 2024 and 2025 by system

By area served and system, the number of docked bikeshare trips in March 2025 and the percentage change from March 2024 on six of the largest systems with data:

  • New York, NY (CitiBike): 3,155,620 (up 19.0%)
  • Washington, DC Metro (Capital Bikeshare): 397,512 (up 19.7%)
  • San Francisco, CA (Bay Wheels): 299,585 (up 37.9%)
  • Chicago, IL (Divvy): 207,436 (down 8.0%)
  • Boston Metro, MA (Blue Bikes): 270,615 (up 5.2%)
  • Jersey City, NJ (CitiBike): 73,047 (up 14.4%)    
     

For additional information, data for additional systems, and interactive charts, please visit BTS' Bikeshare and E-scooters. Data available for Columbus, OH (CoGo) through February 2025; Los Angeles, CA (Metro Bike Share) through December 2024; Philadelphia, PA (Indego) through December 2024; and Pittsburgh, PA (Healthy Ride, now POGOH) through February 2025.

To receive updates from BTS directly to your email, please consider subscribing to our GovDelivery service


U.S. Department of Transportation | 1200 New Jersey Avenue, SE | Washington DC 20590 | 855-368-4200 GovDelivery logo

Share :

Facebook Twitter Google+ Lintasme

Related Post:

0 Komentar untuk "Docked Bikeshare Trips – March 2025"

Back To Top