| US Airlines gain $3.8 billion in second quarter 2024, a decrease from second quarter 2023 Friday, September 20, 2024 BTS 45-24 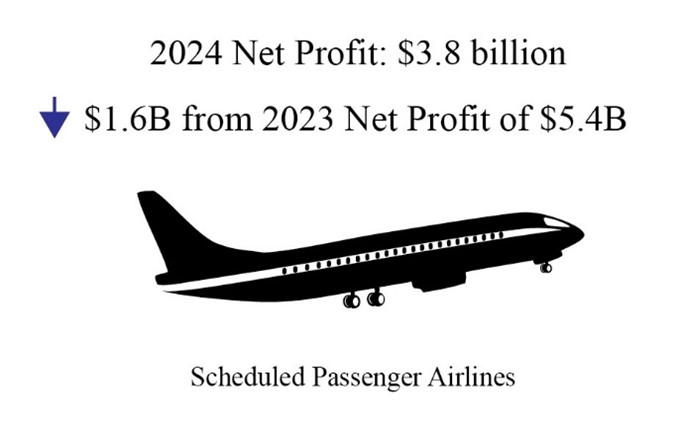
U.S. airline financial reports are filed quarterly with the Bureau of Transportation Statistics (BTS). See the tables that accompany this release on the BTS website for additional second-quarter (Tables 1-6) financial results.
2Q 2024 Results for All 25 Scheduled U.S. Passenger Airlines
U.S. scheduled passenger airlines reported a second-quarter 2024 after-tax net gain of $3.8 billion and a pre-tax operating gain of $6.3 billion. One year earlier, in the second quarter of 2023, the airlines reported an after-tax net gain of $5.4 billion and a pre-tax operating gain of $7.7 billion. 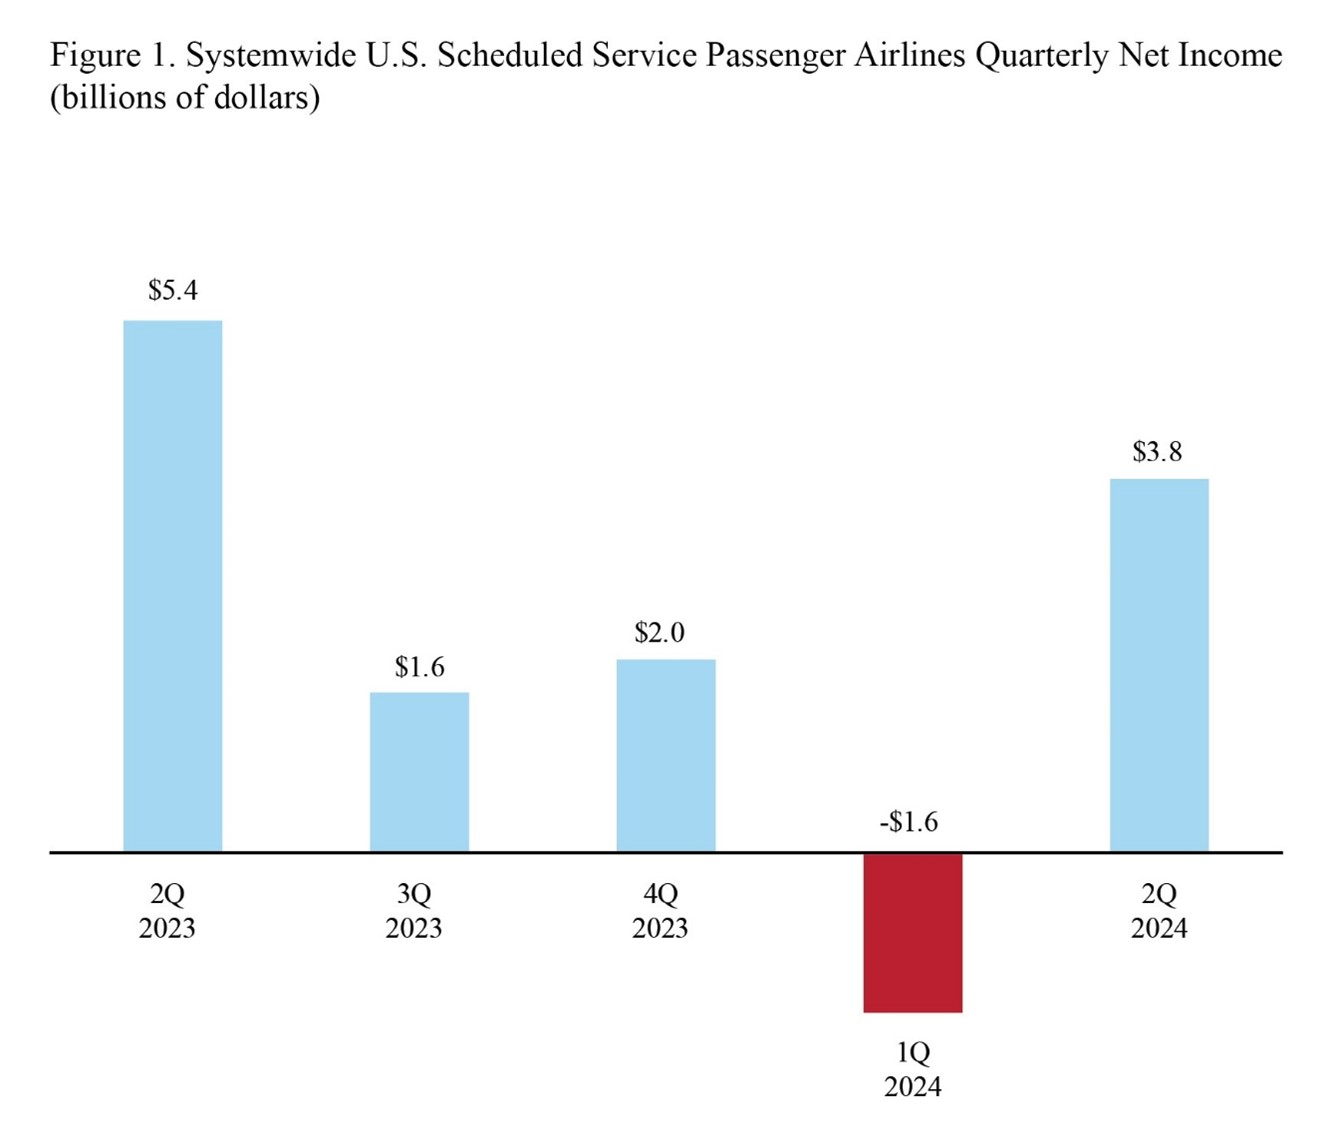
After-tax net income - $3.8 billion gain in 2Q 2024
- Compared to $1.6 billion loss in 1Q 2024
- Compared to $5.4 billion gain in 2Q 2023
Pre-tax operating profit - $6.3 billion gain in 2Q 2024
- Compared to $290 million loss in 1Q 2024
- Compared to $7.7 billion gain in 2Q 2023
- Total 2Q 2024 operating revenue: $65.4 billion
- Share of total 2Q 2024 operating revenue:
- Fares: $49.4 billion, 75.5%, compared to 76.5% in 2Q 2023
- Baggage fees: $1.9 billion, 3.0%, compared to 2.9% in 2Q 2023
- Reservation change fees: $275 million, 0.4%, compared to 0.4% in 2Q 2023
Fees are included for calculations of net income, operating revenue and operating profit or loss. - Total 2Q 2024 operating expenses: $59.1 billion:
- Share of total 2Q 2024 operating expenses:
- Fuel: $11.8 billion, 19.9%, compared to 19.3% in 2Q 2023
- Labor: $21.1 billion, 35.7%, compared to 35.6% in 2Q 2023
Domestic operations, includes 25 U.S. airlines:
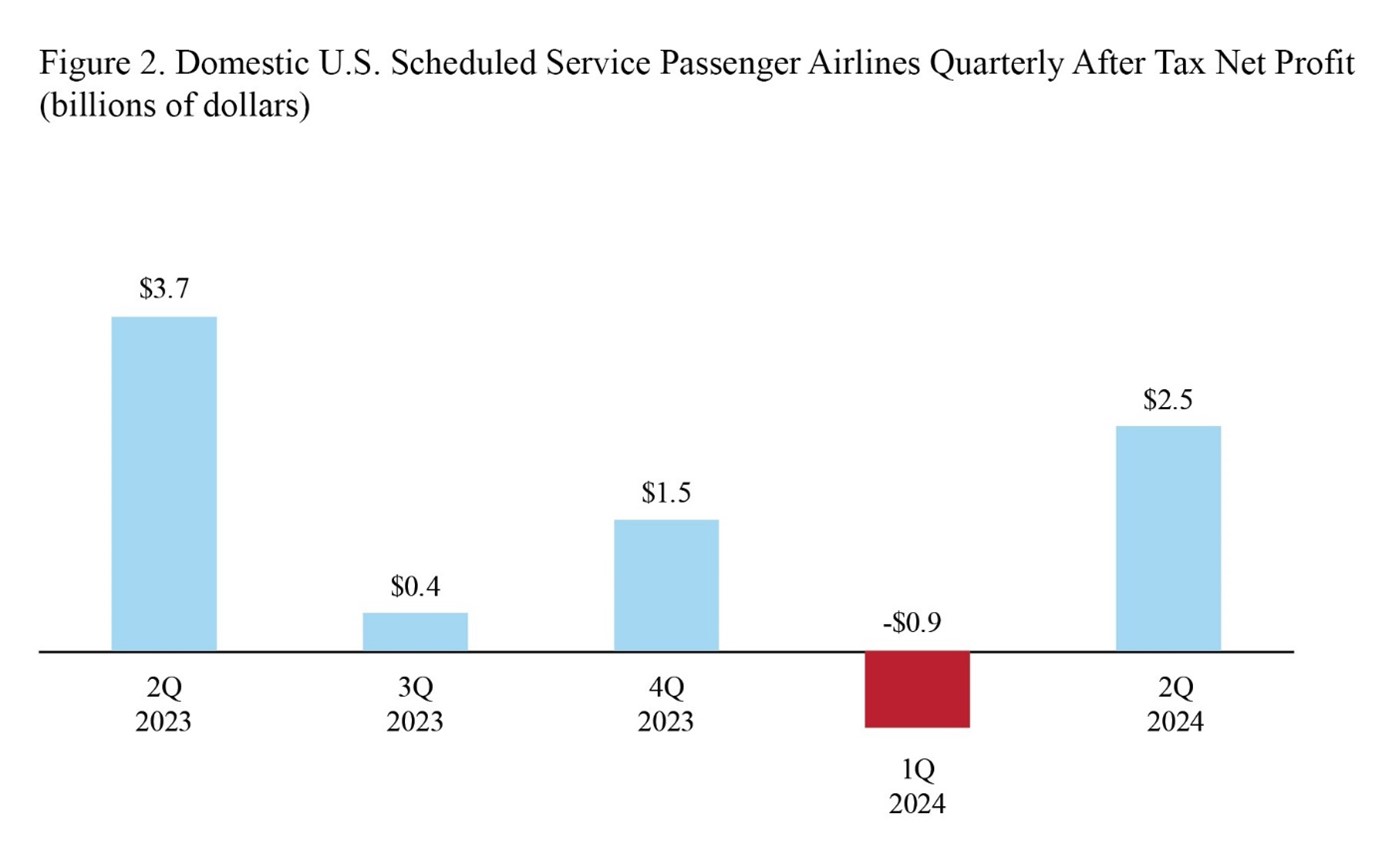
After-tax domestic net profit (net income) - $2.5 billion gain in 2Q 2024
- Compared to $858 million loss in 1Q 2024
- Compared to $3.7 billion gain in 2Q 2023
Pre-tax domestic operating profit - $4.3 billion gain in 2Q 2024
- Compared to $117 million gain in 1Q 2024
- Compared to $5.5 billion gain in 2Q 2023
- 2Q 2024 domestic operating revenue: $48.3 billion
- Share of total 2Q 2024 domestic operating revenue:
- Fares: $34.8 billion, 72.2%, compared to 73.7% in 2Q 2023
- Baggage fees: $1.6 billion, 3.3%, compared to 3.2% in 2Q 2023
- Reservation change fees: $230 million, 0.5%, compared to 0.5% in 2Q 2023
Fees are included for calculations of net income, operating revenue and operating profit or loss. - 2Q 2024 domestic operating expenses: $43.9 billion, of which:
- Share of total 2Q 2024 domestic operating expenses:
- Fuel: $8.0 billion, 18.2%, compared to 17.7% in 2Q 2023
- Labor: $15.6 billion, 35.5%, compared to 35.6% in 2Q 2023
International operations, includes 20 U.S. airlines:
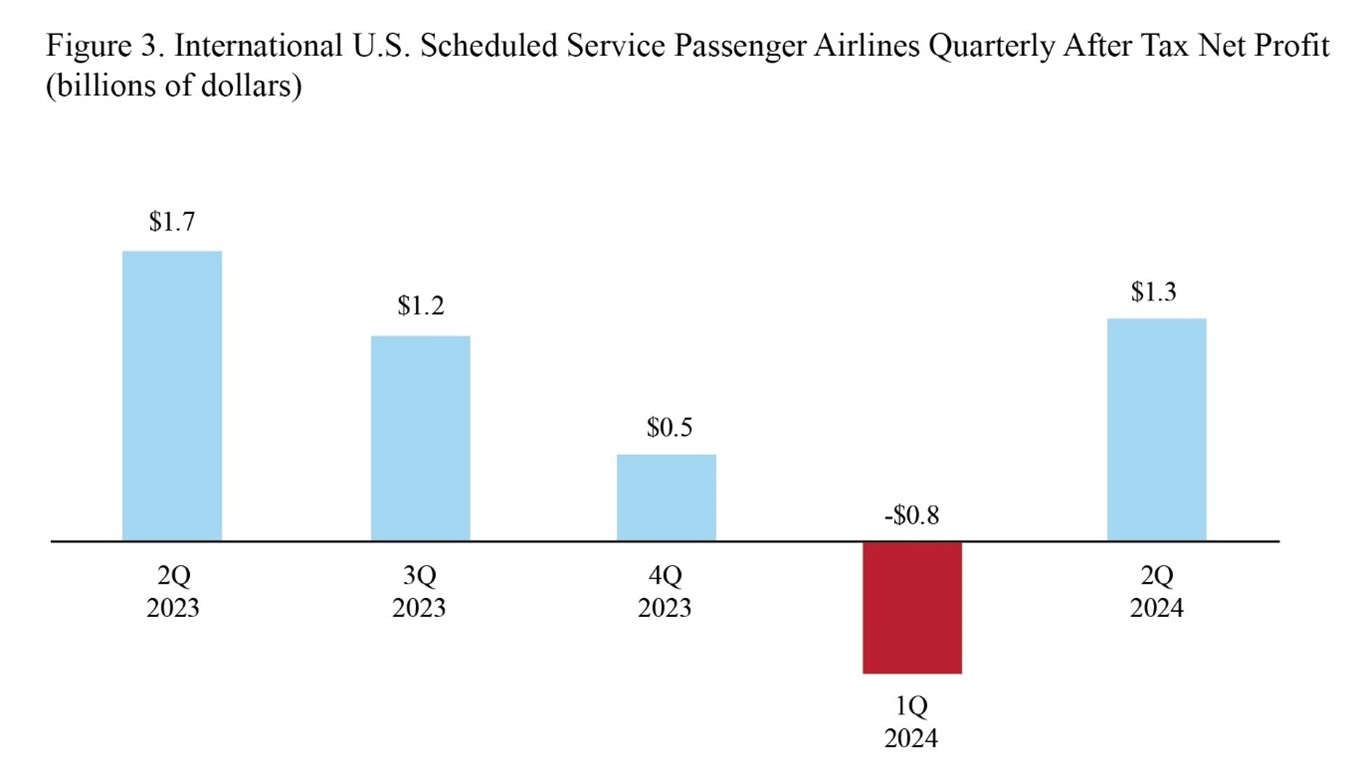
After-tax international net profit (net income) - $1.3 billion gain in 2Q 2024
- Compared to $783 million loss in 1Q 2024
- Compared to $1.7 billion gain in 2Q 2023
Pre-tax international operating profit - $1.9 billion gain in 2Q 2024
- Compared to $407 million loss in 1Q 2024
- Compared to $2.2 billion gain in 2Q 2023
- 2Q 2024 international operating revenue: $17.2 billion, of which:
- Share of 2Q 2024 international operating revenue:
- Fares: $14.6 billion, 84.8%, compared to 84.7% in 2Q 2023
- Baggage fees: $374 million, 2.2%, compared to 2.2% in 2Q 2023
- Reservation change fees: $45 million, 0.3%, compared to 0.3% in 2Q 2023
Fees are included for calculations of net income, operating revenue and operating profit or loss.
- 2Q 2024 international operating expenses: $15.2 billion, of which:
- Share of 2Q 2024 international operating expenses:
- Fuel: $3.8 billion, 24.9%, compared to 23.7% in 2Q 2023
- Labor: $5.5 billion, 36.3%, compared to 35.7% in 2Q 2023
2nd Quarter Margins
Net margin is the net income or loss as a percentage of operating revenue. Operating margin is the operating profit or loss as a percentage of operating revenue. Systemwide:
Net income margin: - 5.8% in 2Q2024
- Compared to 8.7% in 2Q2023
Operating margin: - 9.6% in 2Q2024
- Compared to 12.2% in 2Q2023
Domestic
Net income margin: - 5.2% in 2Q2024
- Compared to 8.0% in 2Q2023
Operating margin: - 9.0% in 2Q2024
- Compared to 11.8% in 2Q2023
International
Net income margin: - 7.7% in 2Q2024
- Compared to 10.5% in 2Q2023
Operating margin: - 11.3% in 2Q2024
- Compared to 13.4% in 2Q2023
Reporting notes
Additional data: BTS website, see tables for operating profit/loss, operating revenue and fuel cost and consumption. See the BTS financial databases for more detailed data including numbers for individual airlines.
Filing requirement: By regulation, for the quarter ending Dec. 31, airlines that operate at least one aircraft that is designed/certified for more than 60 seats or the capacity to carry a payload of passengers and cargo weighing more than 18,000 pounds must report financial data to BTS by March 31. The airline filings are subject to a process of quality assurance and data validations before release to the public. Data updates: Revised carrier data and late data filings will be made available monthly on TranStats on the Monday following the second Tuesday of the month. All data are subject to revision. BTS will release third-quarter 2024 data on December 18, 2024. Missing carriers: The information provided within BTS statistical releases may not be based on 100% of reporting carriers. Generally, data are released per schedule if reports have been received from at least 90% of the carriers, along with data from all the major carriers. Regarding this release, the following carriers remain pending: ZW (Air Wisconsin Airlines), NC (Northern Air Cargo) and KH (Aloha Air Cargo). Also, within text, percent change results may not be exact due to rounding.
| U.S. Department of Transportation | 1200 New Jersey Avenue, SE | Washington DC 20590 | 855-368-4200 |  | |


0 Komentar untuk "US Airlines gain $3.8 billion in second quarter 2024, a decrease from second quarter 2023"