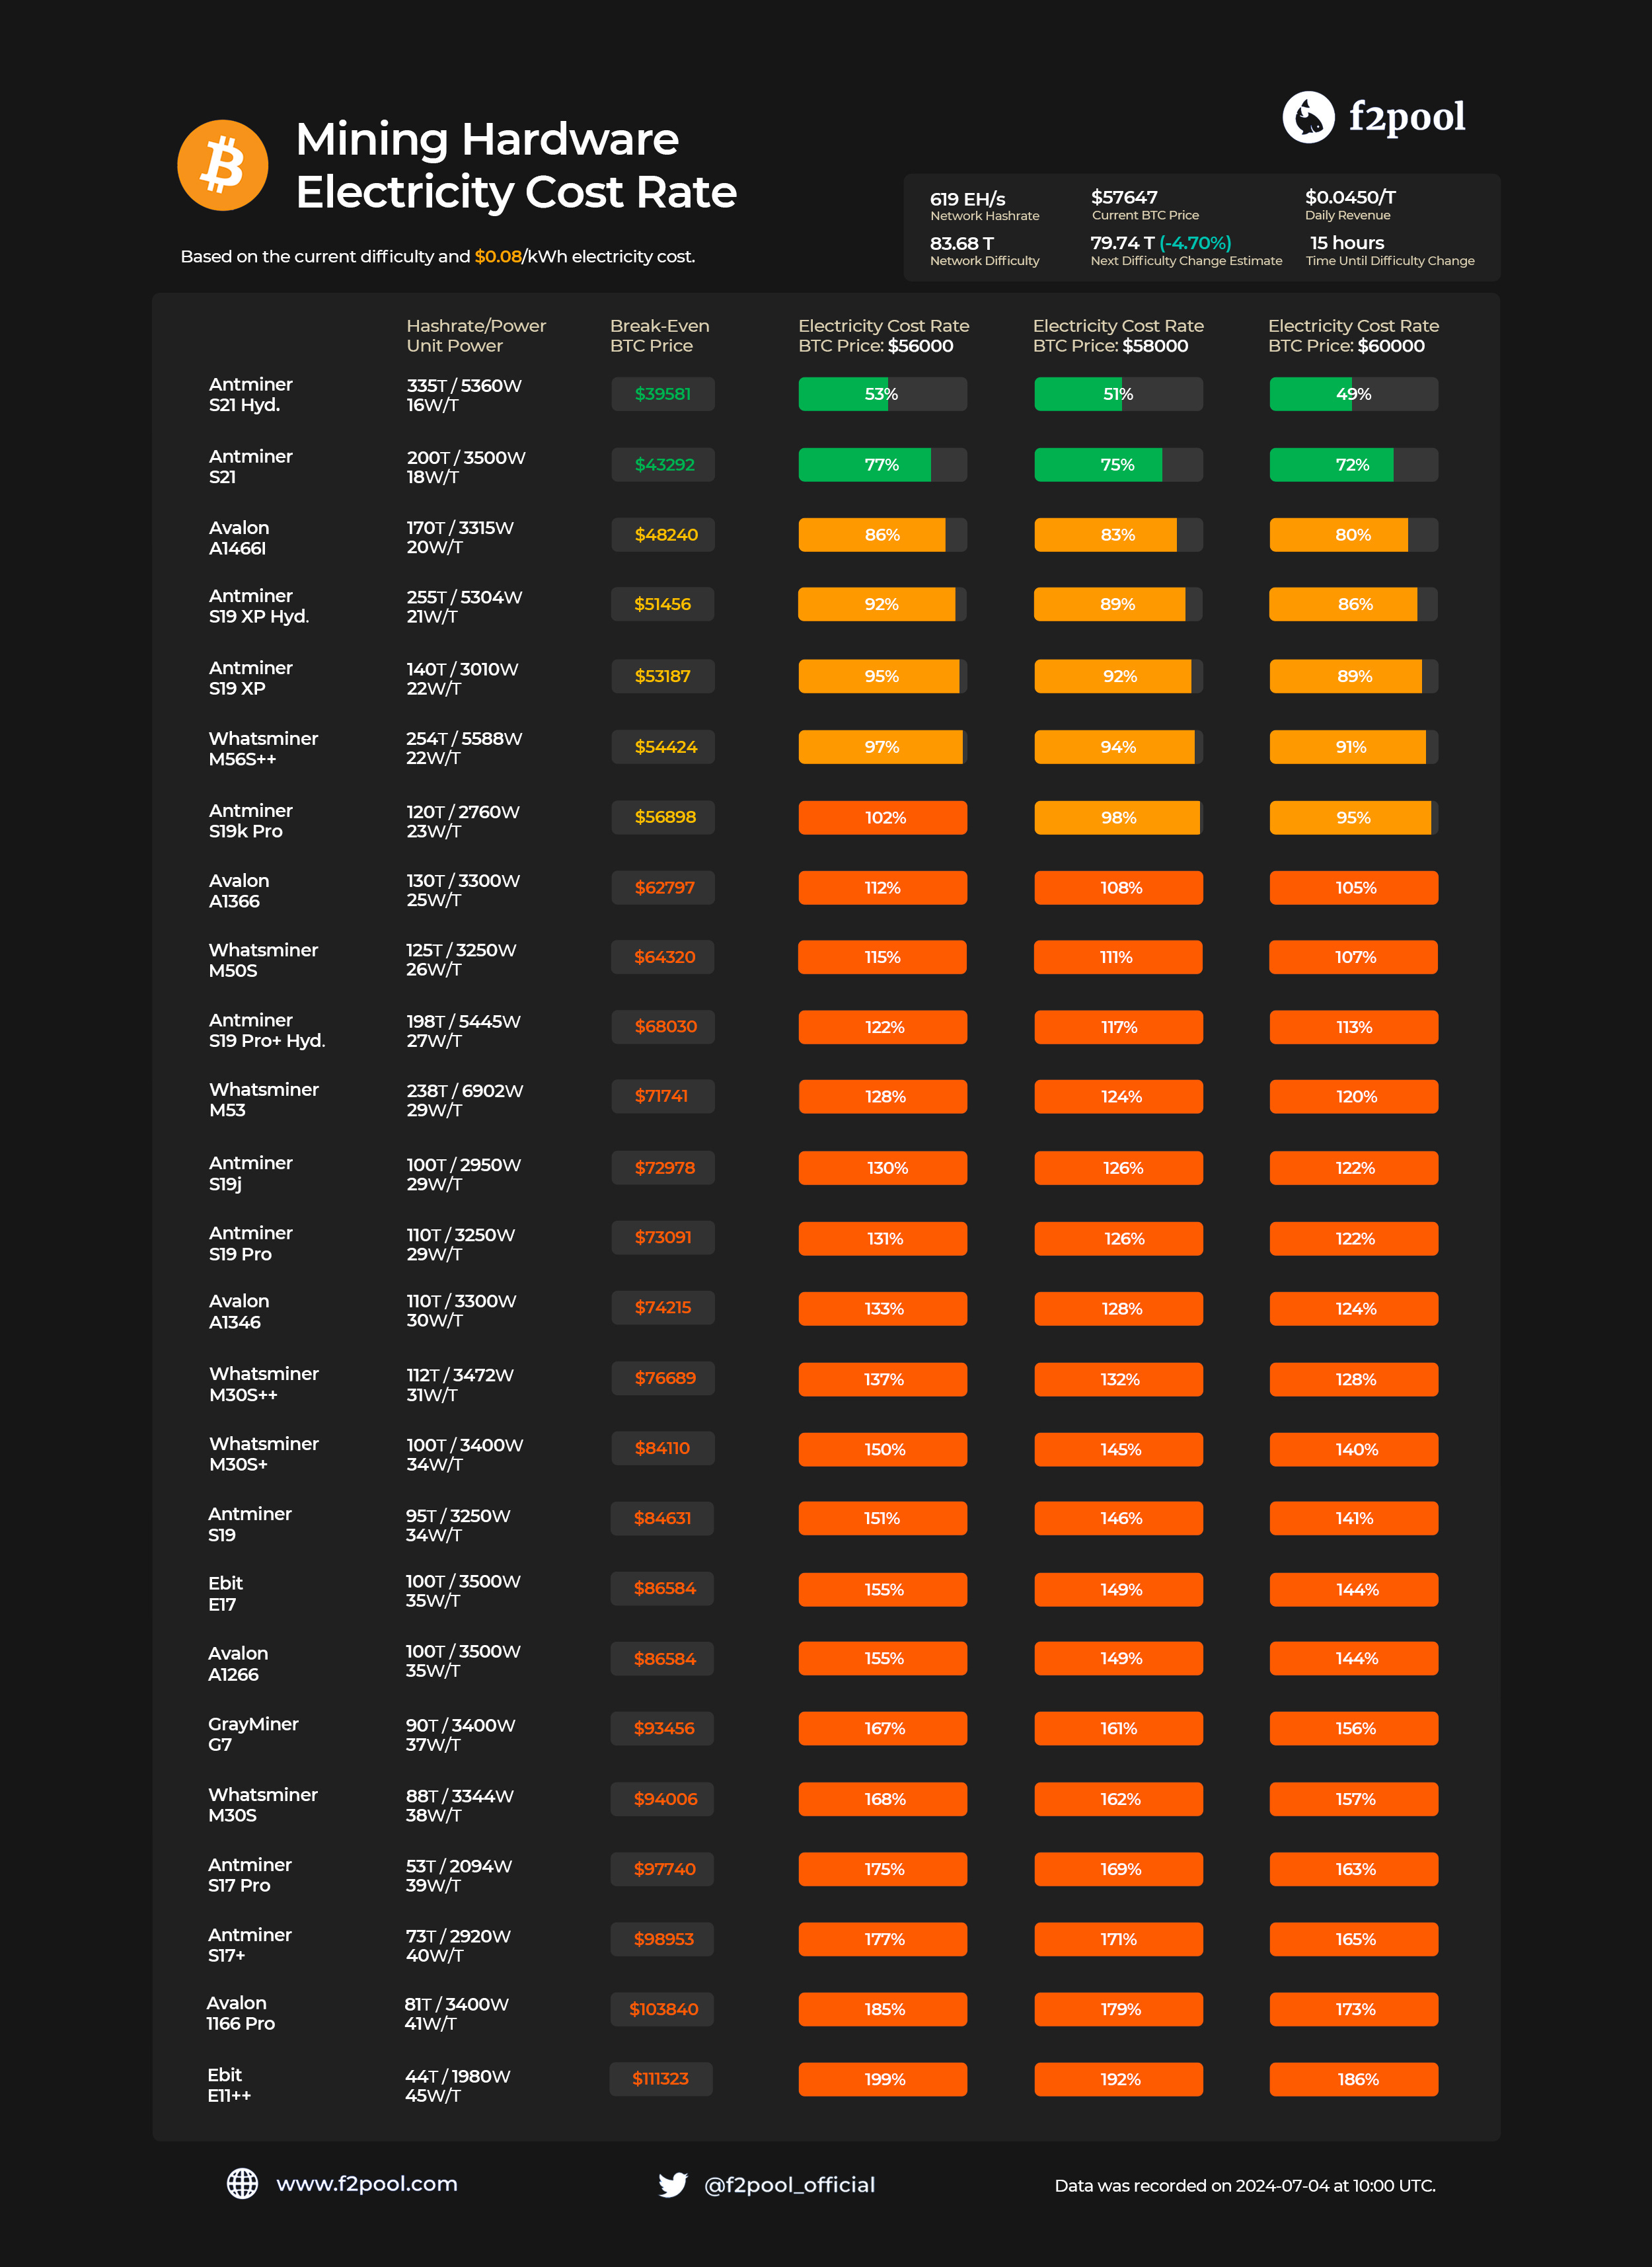
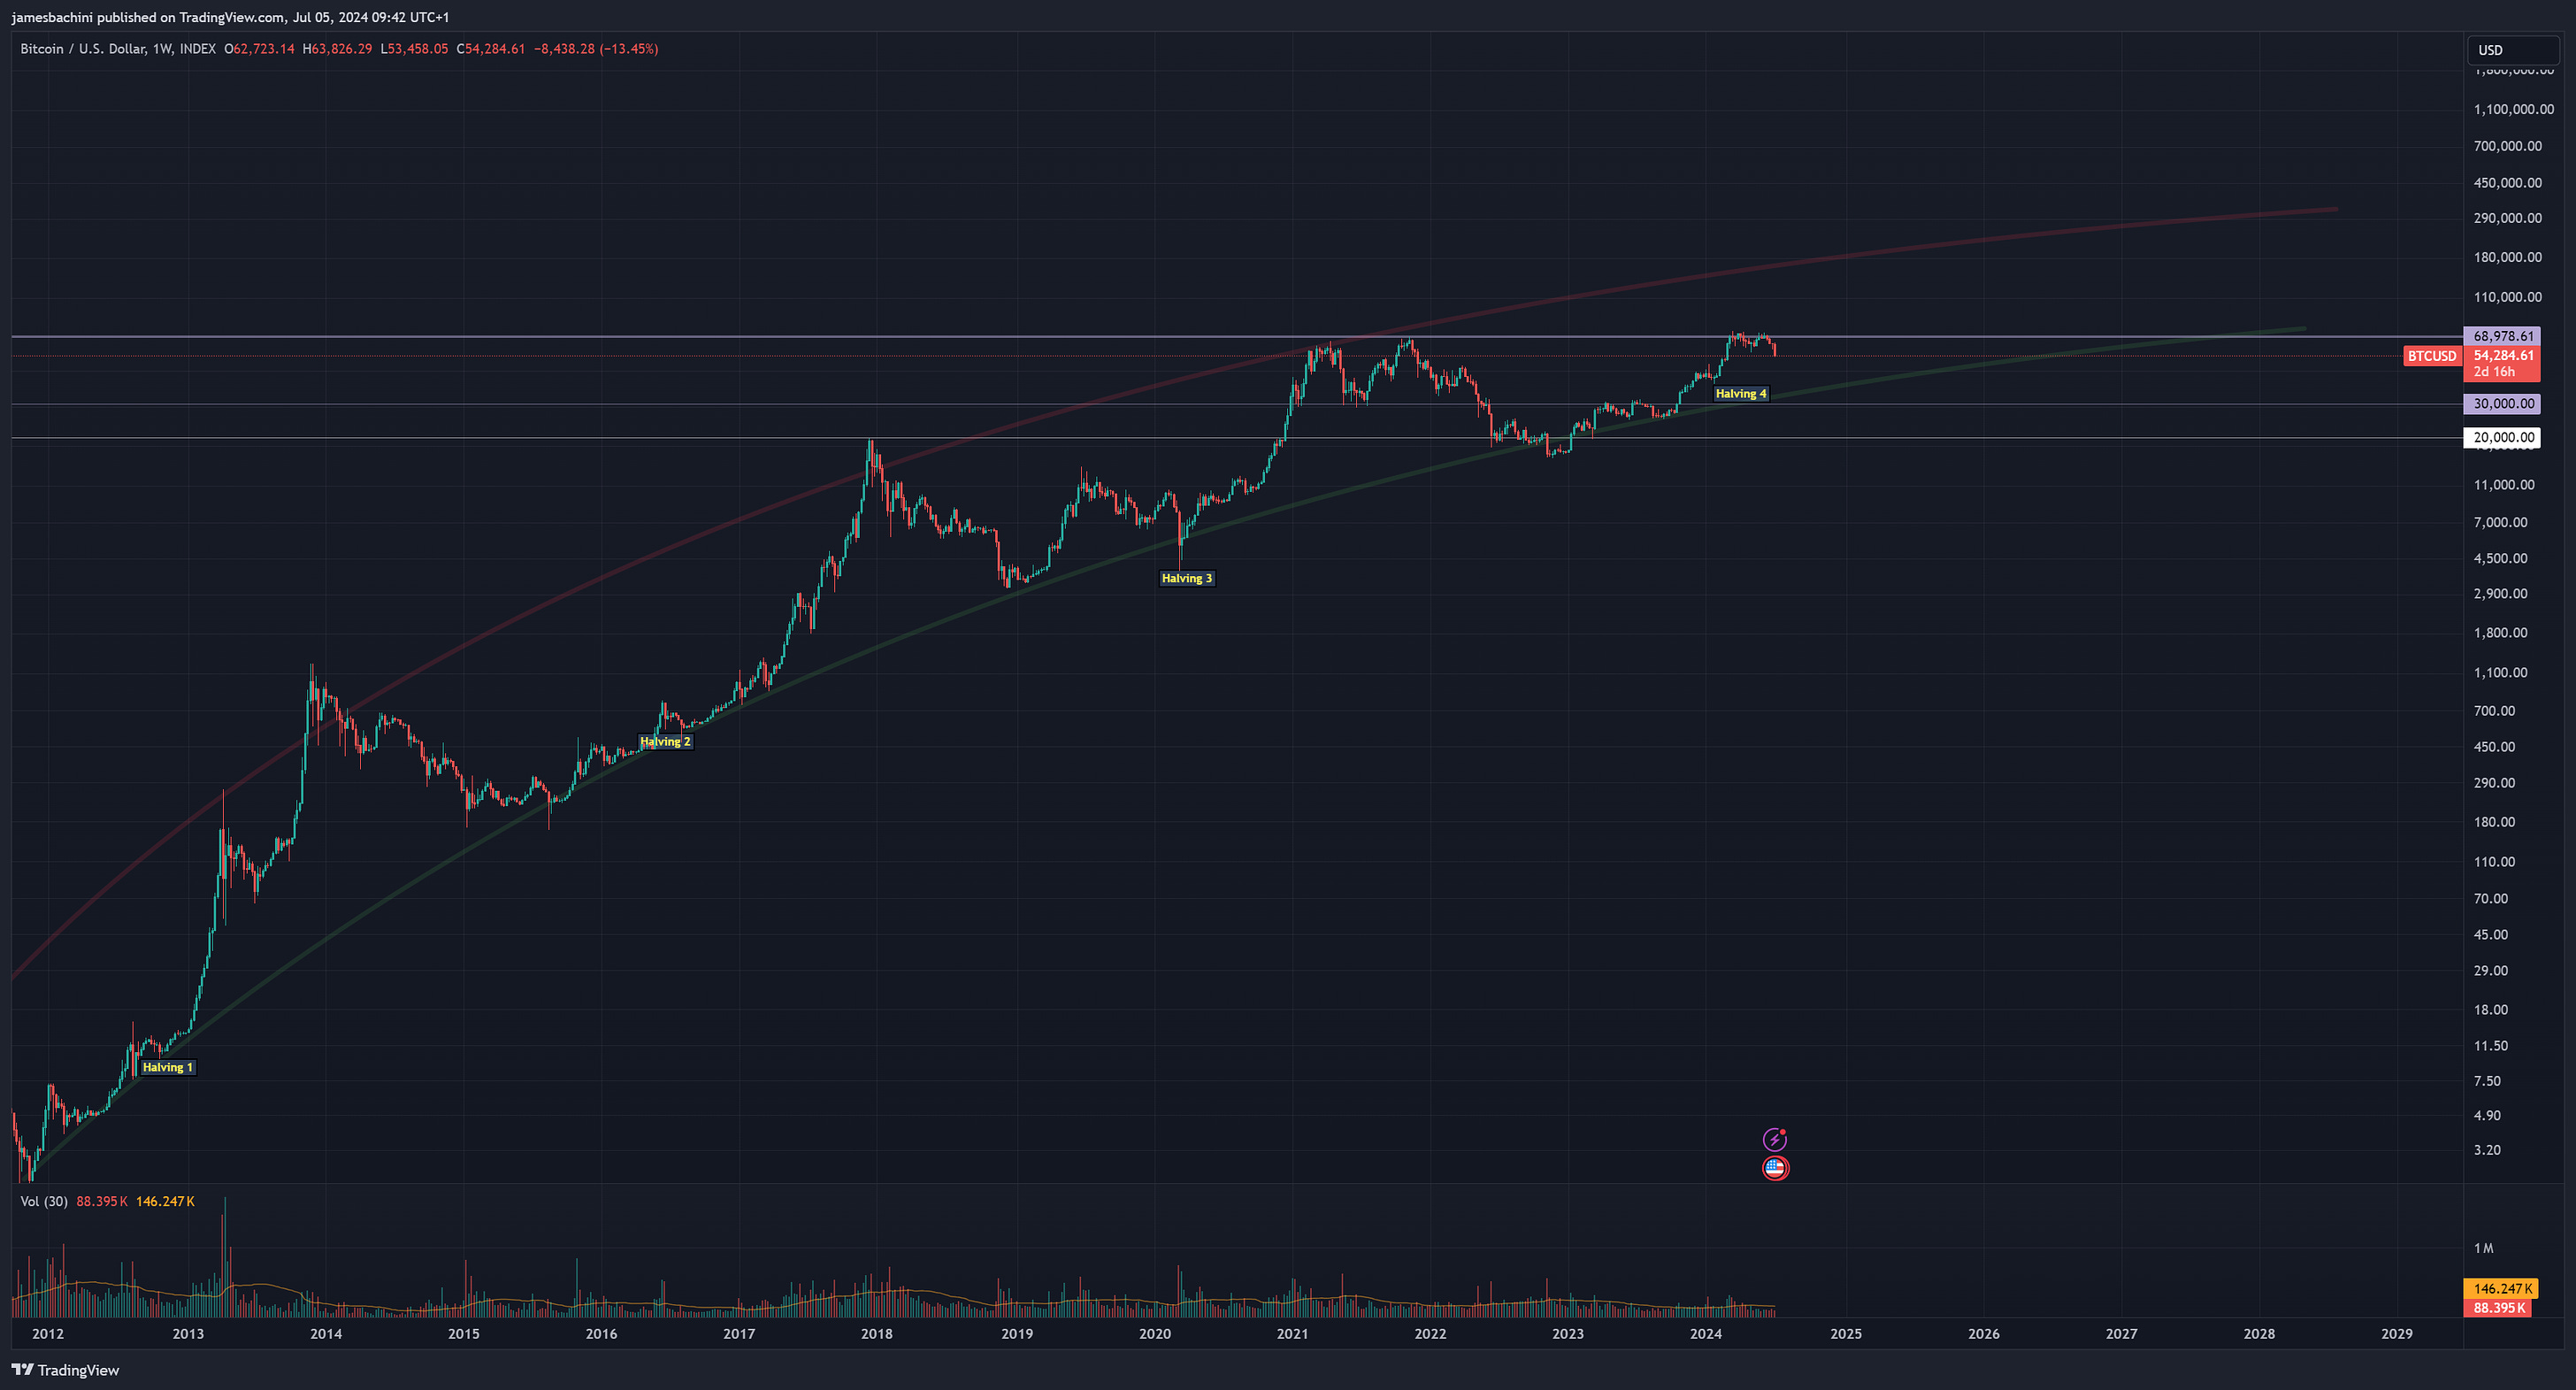
The blockchain sector has been watching with bated breath as Bitcoin continues to fall to $54k at time of writing. At the same time the S&P 500 has been inching upwards, fuelled by optimism around the FED pivot and emerging AI opportunities. This divergence, while not the one crypto enthusiasts had hoped for, offers a shift in market dynamics and Bitcoin's evolving role in the global financial ecosystem. This separation from stock market performance could be a blessing in disguise for the long term prospects of Bitcoin and other digital assets. This post from March highlights the benefits of a decoupling. The last thing we want is for Bitcoin to become just another risk asset. Correlation with traditional markets imposes limitations on Bitcoin's potential and by breaking free from this Bitcoin is asserting its unique value proposition, to define its own trajectory. Why Is Price Going Down?The short term outlook remains challenging with selling pressure, primarily stemming from two sources: Mt. Gox creditors finally receiving their long awaited payments and the German government liquidating 50,000 seized Bitcoin. These events have spooked the market, with supply temporarily overwhelming demand and driving prices down. The crucial question now is - At what point might hodlers lose faith in the four year cycle theory and panic sell? This potential capitulation point could mark the bottom of a shakeout. There’s support at $52k which is currently holding, better support at $42k, below that it starts to get pretty dark. It’s not the first time there’s been an uncomfortable pull back in crypto markets but everyone has a price where they lose hope. Do you buy these moments or sell to make the pain stop? Our psychology works against us in during periods of market volatility with greed and fear being our biggest adversary. Long Term ProspectsDespite these short term headwinds, the long term outlook for digital assets and web3 remains promising.
It might just be a personal bias as a blockchain developer but the tech and fundamentals seem to be going in the right direction, even if this is not reflected in the recent price action.
If a Bitcoin chart looks bad, you can always zoom out to a log chart to make yourself feel better about the destruction of your net worth. The long-term BTC/USD chart does provide some context. Social links are below and if you enjoyed this newsletter I would appreciate it if you could share this content |
.
Copyright © 2015 : All.Semua


0 Komentar untuk "Bitcoin's Fabled Decoupling"