
TransBorder Freight Annual Report 2023Tuesday, May 21, 2024 BTS 25-24
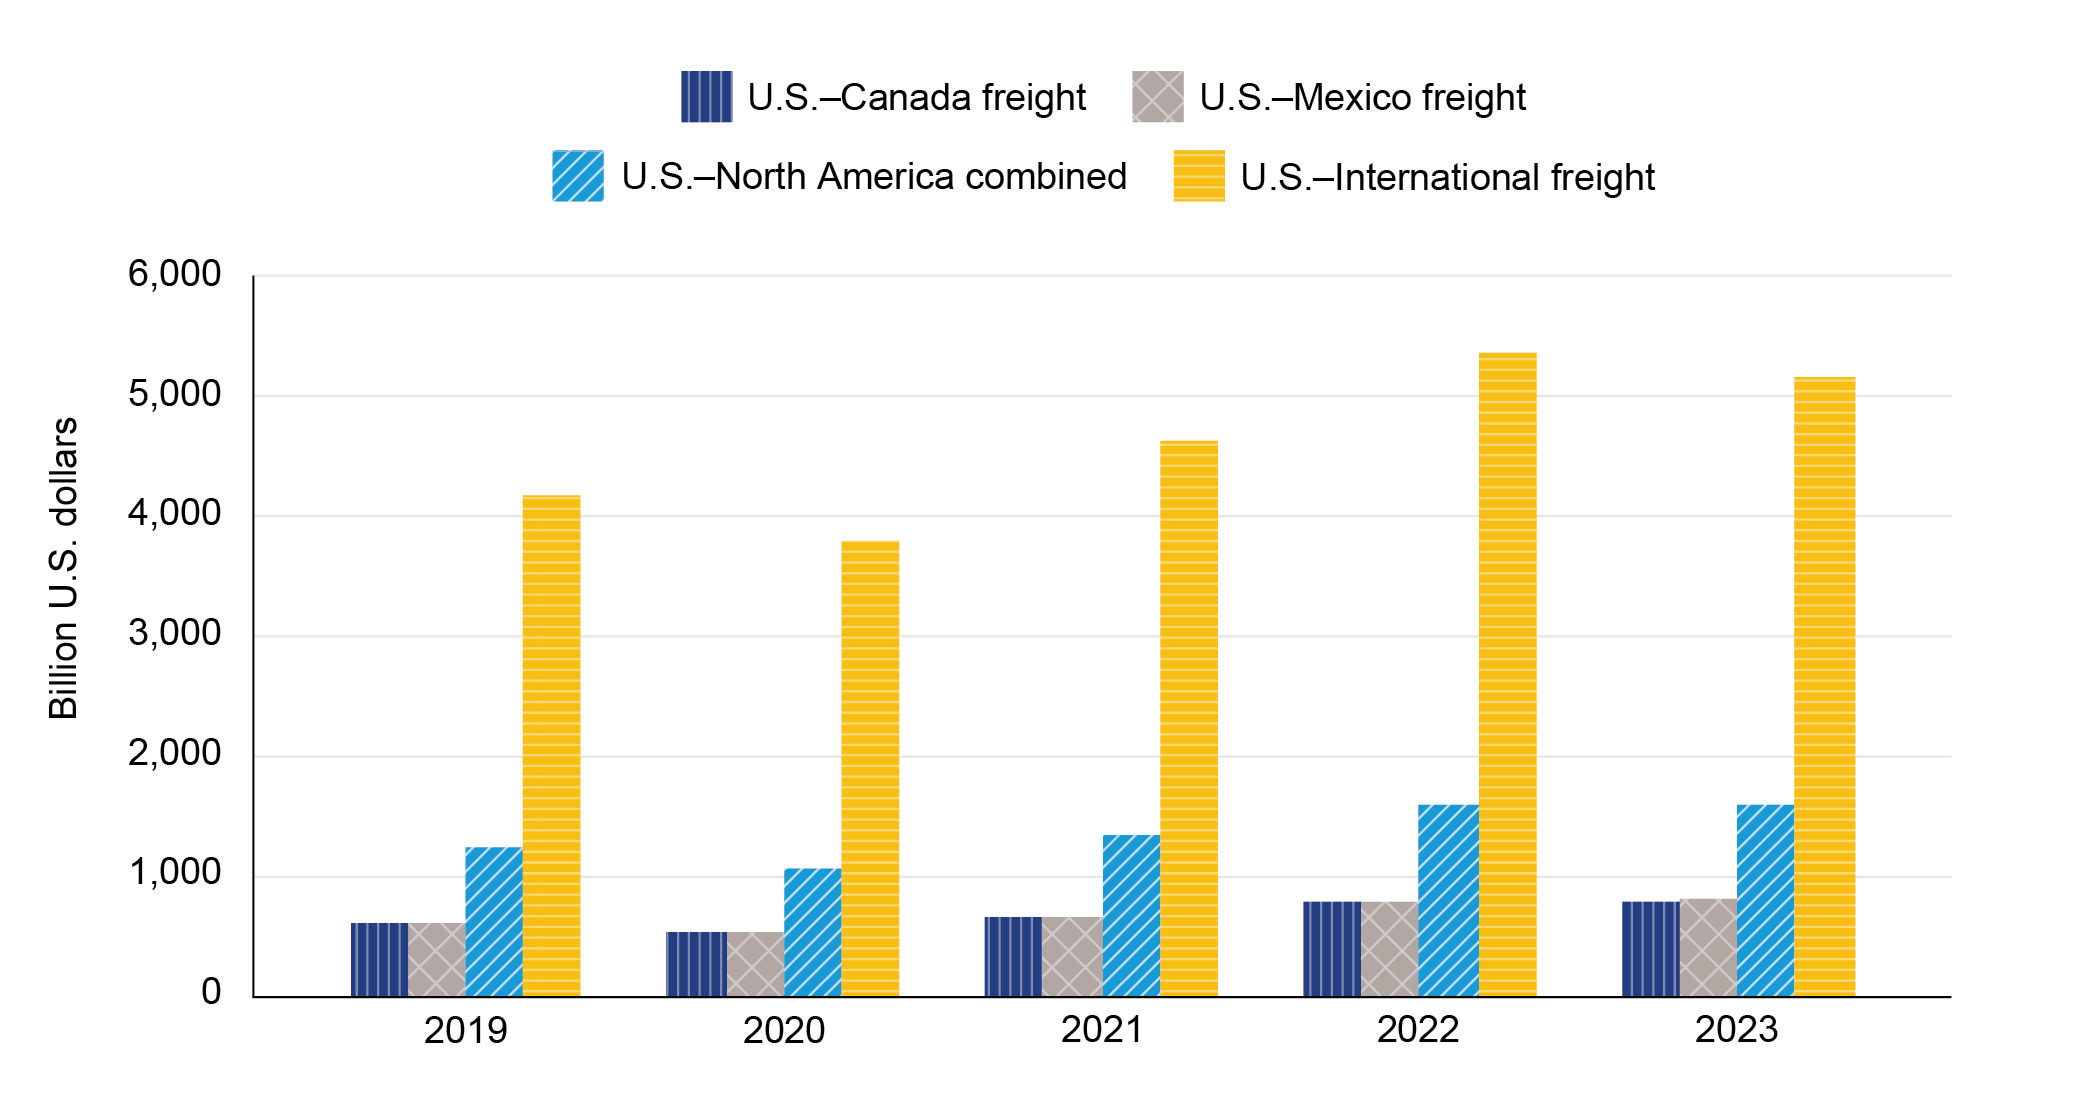
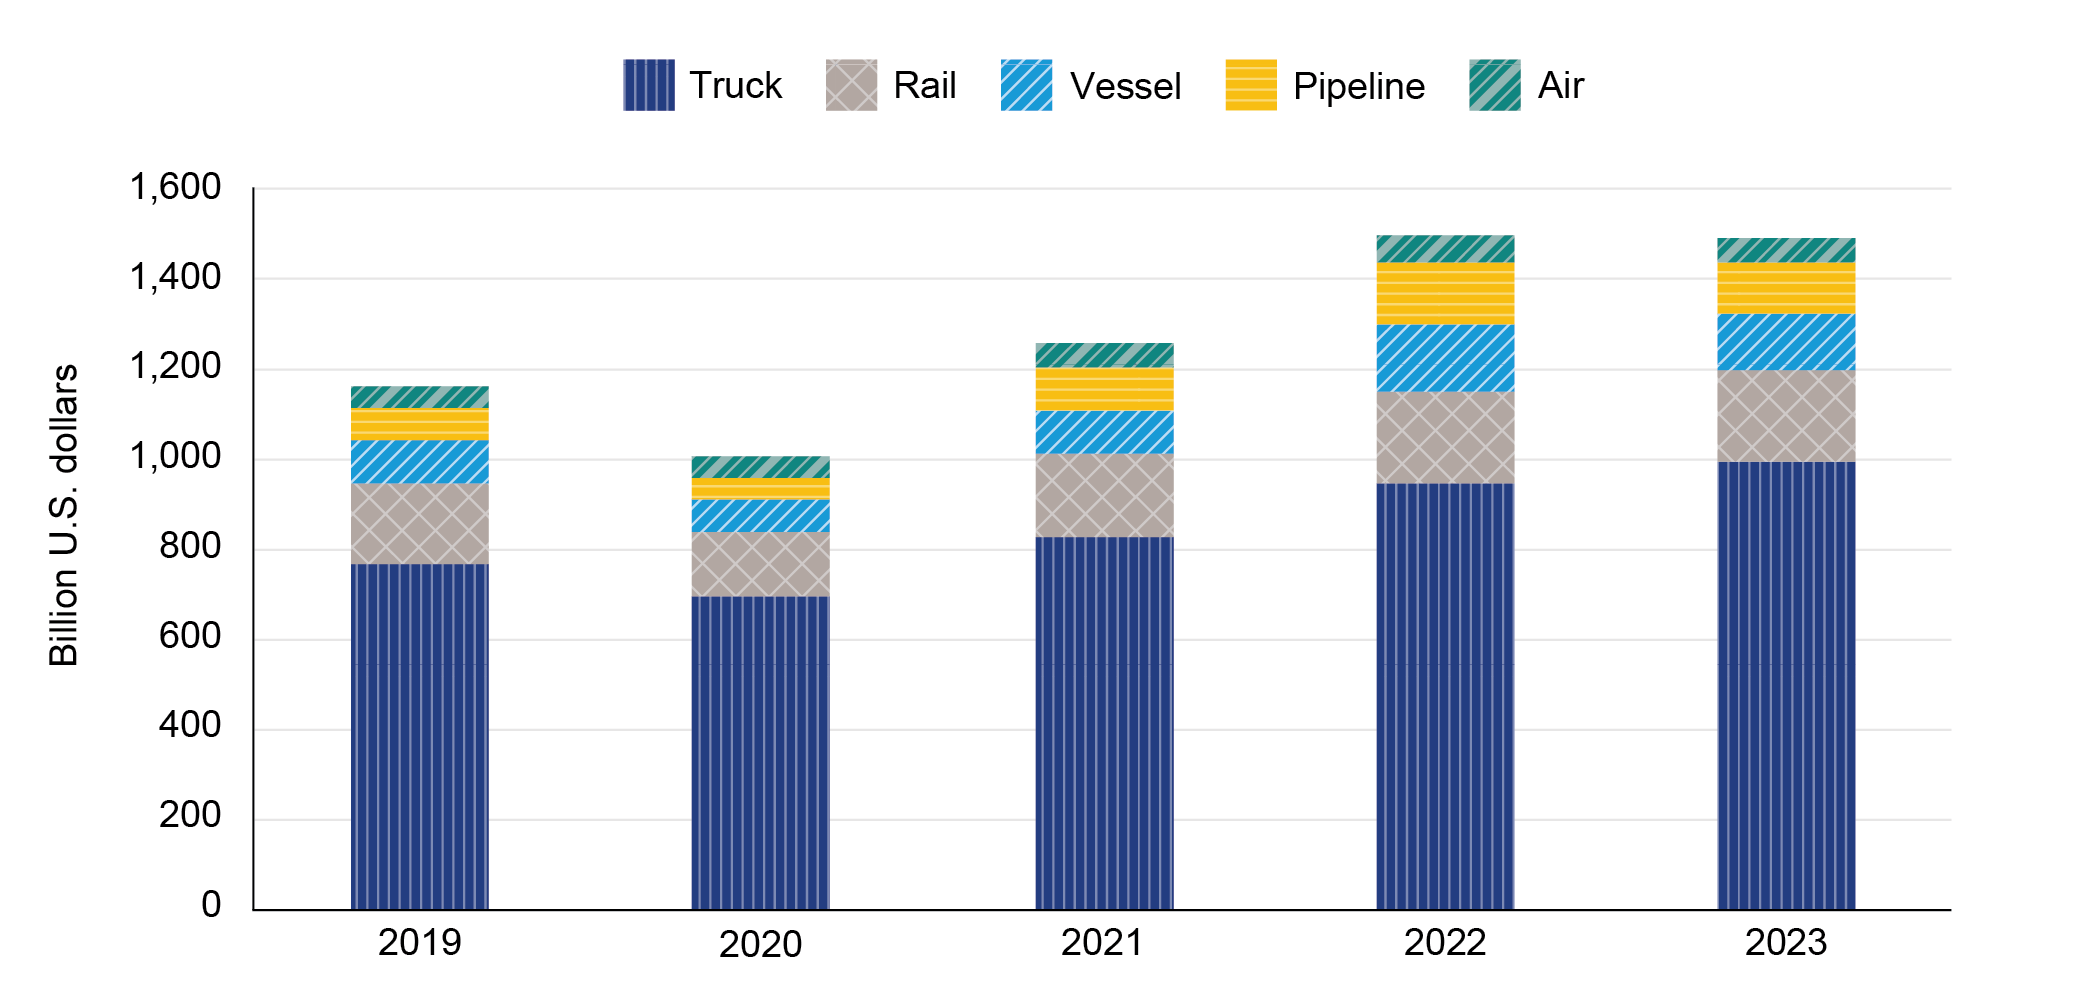
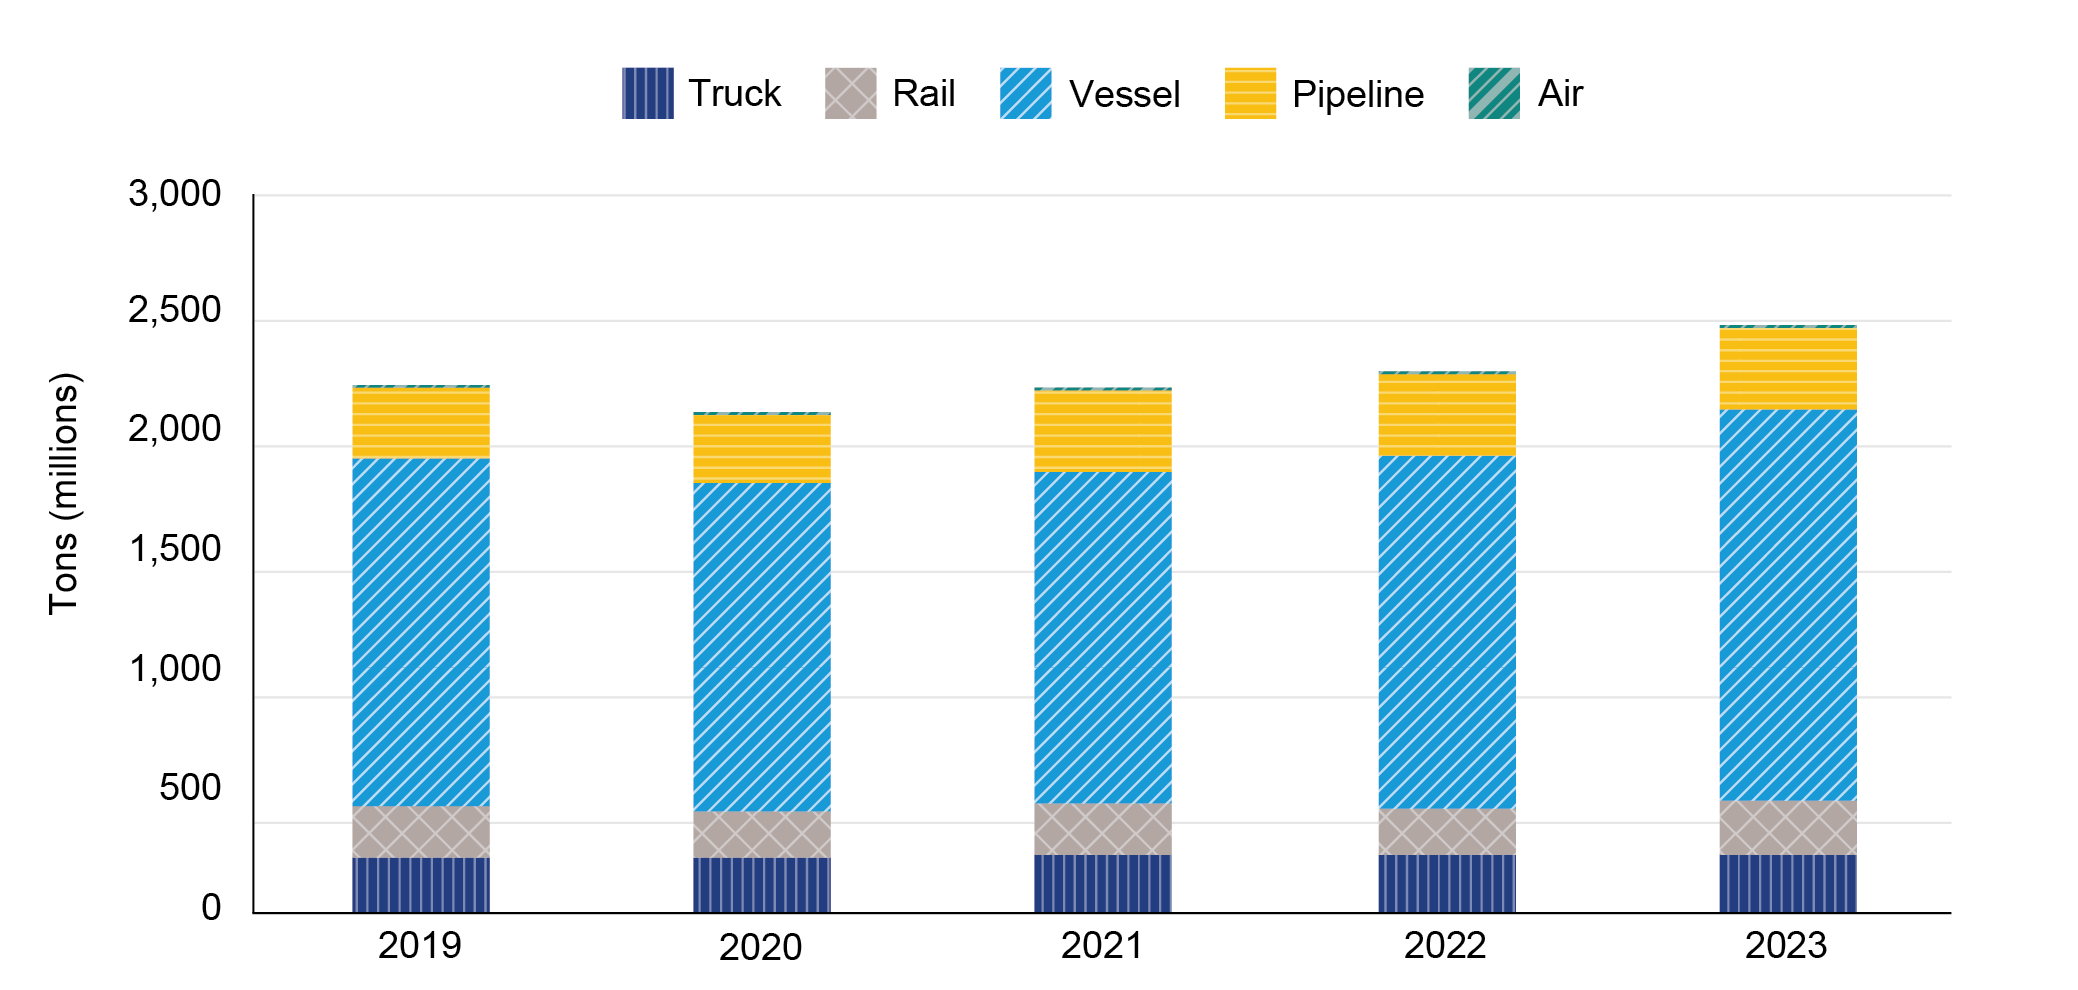
Transborder data is available for 2023! The Bureau of Transportation Statistics (BTS) compiled the dollar value and tonnage of commodities that moved across the United States' land borders with Canada and Mexico. Manufacturing and logistics sectors across North America are highly linked and interdependent. America's land borders with Canada and Mexico are economically vital conduits for North American supply chains, with about $3 billion in daily cross-border trade. Besides oil and energy products, automobiles, and electronics, Canada and Mexico are also America's largest trade partners in agricultural goods. U.S. land borders with Canada and Mexico consistently facilitate over $1 trillion in cross-border trade annually (Table 1a). To put things in perspective, in 2023 the value of total U.S.-international trade was $5.1 trillion, of which U.S. trade with Canada and Mexico comprised 30.8 percent (Table 2). In 2023, U.S. freight flows with Canada and Mexico equaled $1.57 trillion dollars. The total weight of that trade was 2,484.7 million tons (Table 4). While the weight of freight increased 8.8% from 2022, the dollar value of North American freight in 2023 remained unchanged. Surface modes of transportation (truck + rail) lead North American commerce, together accounting for 80.3% of all freight flows by dollar value in 2023. Trucking continued to be the dominant form of freight transportation in North America, accounting for 60.1% of total flows in Canada and 72.2% in Mexico (Table 3). Rail was second place with 15.7% with Canada and 12.3% with Mexico (Table 1b).
Table 1a. Value of Monthly U.S.-North American Freight Flows
Note: Totals includes mail and other. Source: Bureau of Transportation Statistics, Transborder Freight Data, available at https://data.bts.gov/stories/s/myhq-rm6q, adapted from U.S. Census Bureau, International Trade in Goods and Services.
Table 1b. Modal Percent Value of U.S. Merchandise Trade with Canada and Mexico: 2023 Source: Bureau of Transportation Statistics, Transborder Freight Data, available at https://data.bts.gov/stories/s/myhq-rm6q, adapted from U.S. Census Bureau, International Trade in Goods and Services.
Table 2: Value of U.S. Freight with Canada and Mexico as a Percentage of Total U.S. Trade: 2019 - 2023 Source: Bureau of Transportation Statistics, Transborder Freight Data, available at https://data.bts.gov/stories/s/myhq-rm6q, adapted from U.S. Census Bureau, International Trade in Goods and Services.
Source: Bureau of Transportation Statistics, Transborder Freight Data, available at https://data.bts.gov/stories/s/myhq-rm6q, adapted from U.S. Census Bureau, International Trade in Goods and Services.
U.S.-North American Freight Points
Figure 2. Value of U.S. Trade with Canada and Mexico by Mode: 2019 – 2023 (USD Actual)
Source: Bureau of Transportation Statistics, Transborder Freight Data, available at https://data.bts.gov/stories/s/myhq-rm6q, adapted from U.S. Census Bureau, International Trade in Goods and Services.
Table 3b: U.S.-Mexico Freight by Truck: 2023
U.S.-Canada Data Points
U.S.-Mexico Data Points
Table 4. Weight of U.S.-International Freight by Mode: 2019 - 2023
Sources: Bureau of Transportation Statistics, Federal Highway Administration, Freight Analysis Framework Version 5.5.1 https://faf.ornl.gov
Figure 3. Weight of U.S.-International Freight by Mode: 2019 – 2023 (Millions of Tons)
Source: Bureau of Transportation Statistics, Transborder Freight Data, available at https://data.bts.gov/stories/s/myhq-rm6q, adapted from U.S. Census Bureau, International Trade in Goods and Services.
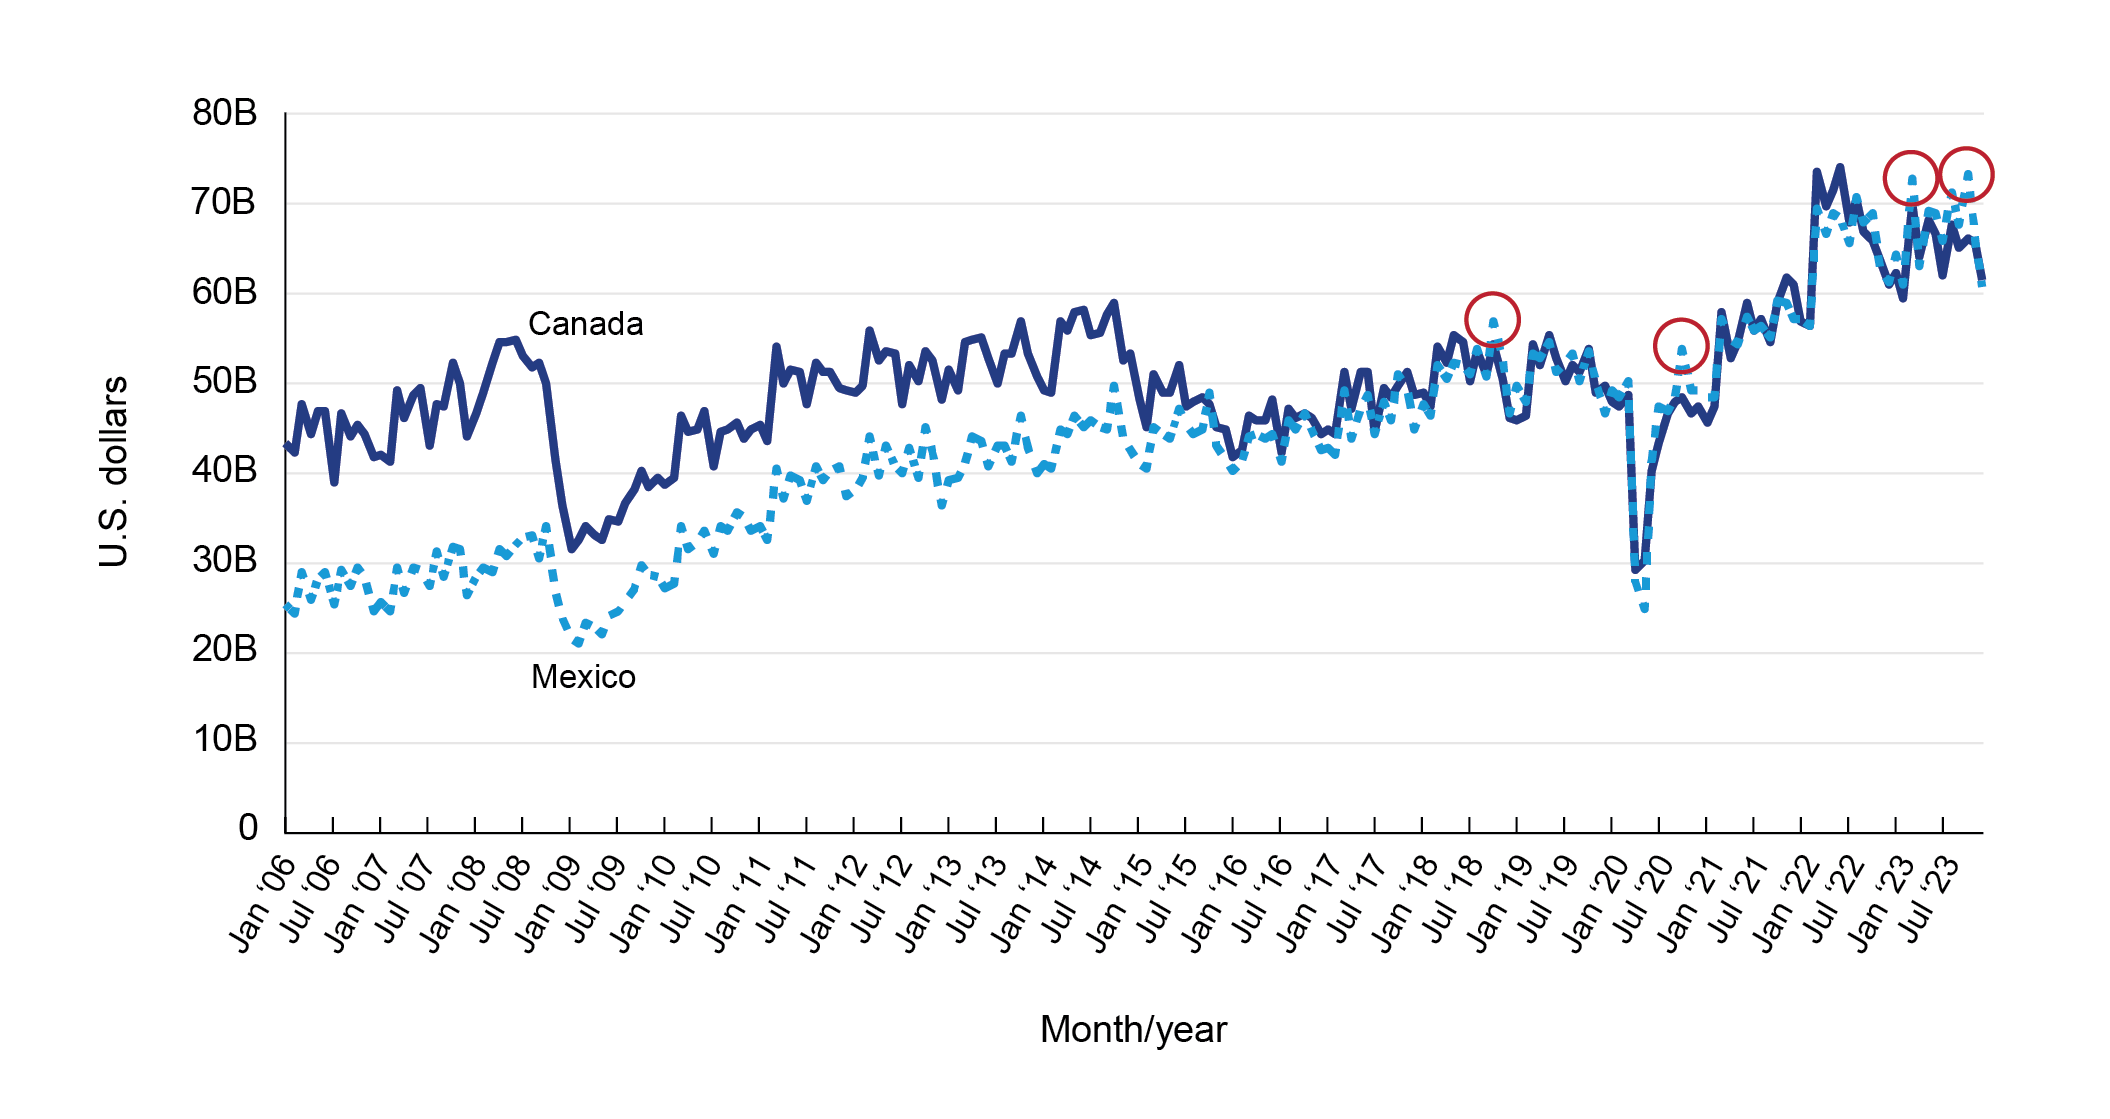
Since earlier than 2006, U.S. freight flows with Canada by value had commonly exceeded that with Mexico. However, starting in 2015, there have been several instances where U.S. freight with Mexico by value has surpassed that of Canada (Figure 3). This trend first appeared in October 2015 and has continued and extended through the COVID-19 pandemic. Interestingly, during this same period, the weight of freight flows with Canada has continued to exceed that of Mexico. U.S. freight flows with Canada by weight continue to be greater than Mexico due to petroleum and mineral fuels transported by pipeline (Figure 4a). In 2023, the dollar value of mineral fuel flows with Canada and Mexico decreased between 16 and 20 percent from 2022.
Source: Bureau of Transportation Statistics, Transborder Freight Data, available at https://data.bts.gov/stories/s/myhq-rm6q, adapted from U.S. Census Bureau, International Trade in Goods and Services.
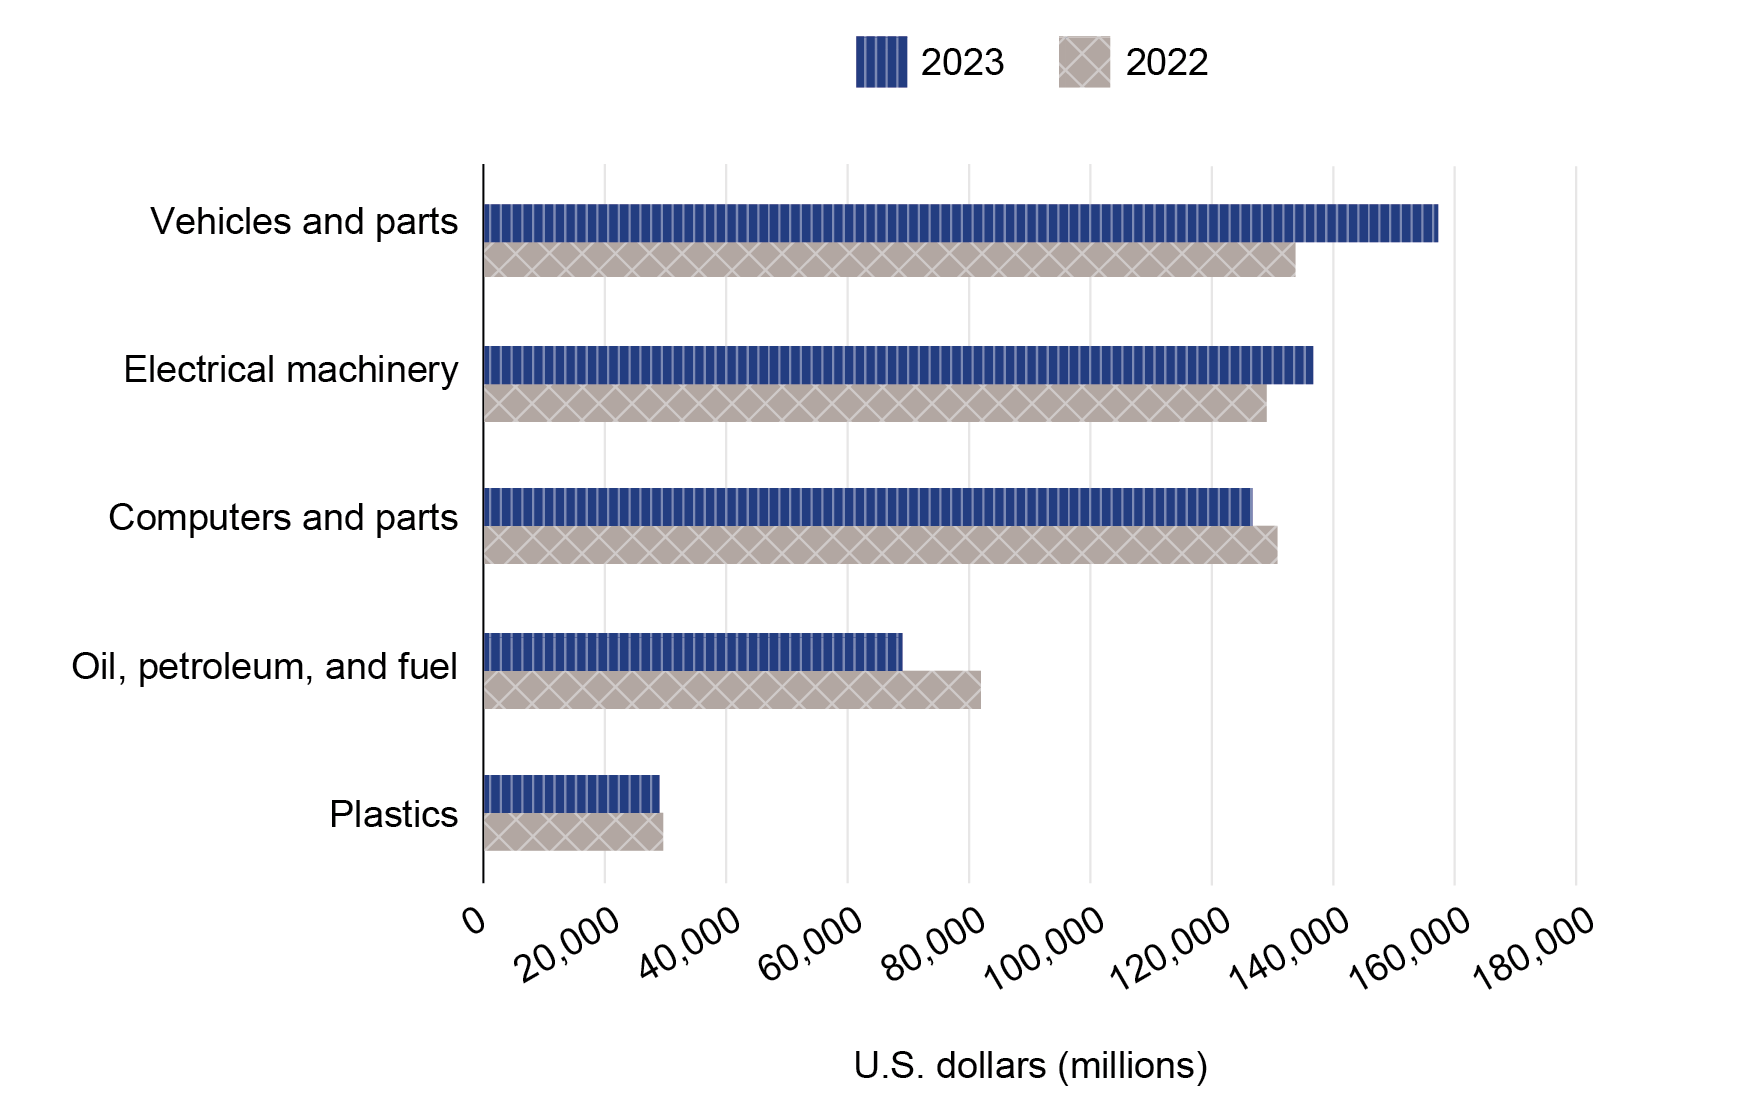
Figure 5a: Top U.S.-Canada Commodities by Value (Millions USD): 2022 - 2023
Source: Bureau of Transportation Statistics, Transborder Freight Data, available at https://data.bts.gov/stories/s/myhq-rm6q, adapted from U.S. Census Bureau, International Trade in Goods and Services.
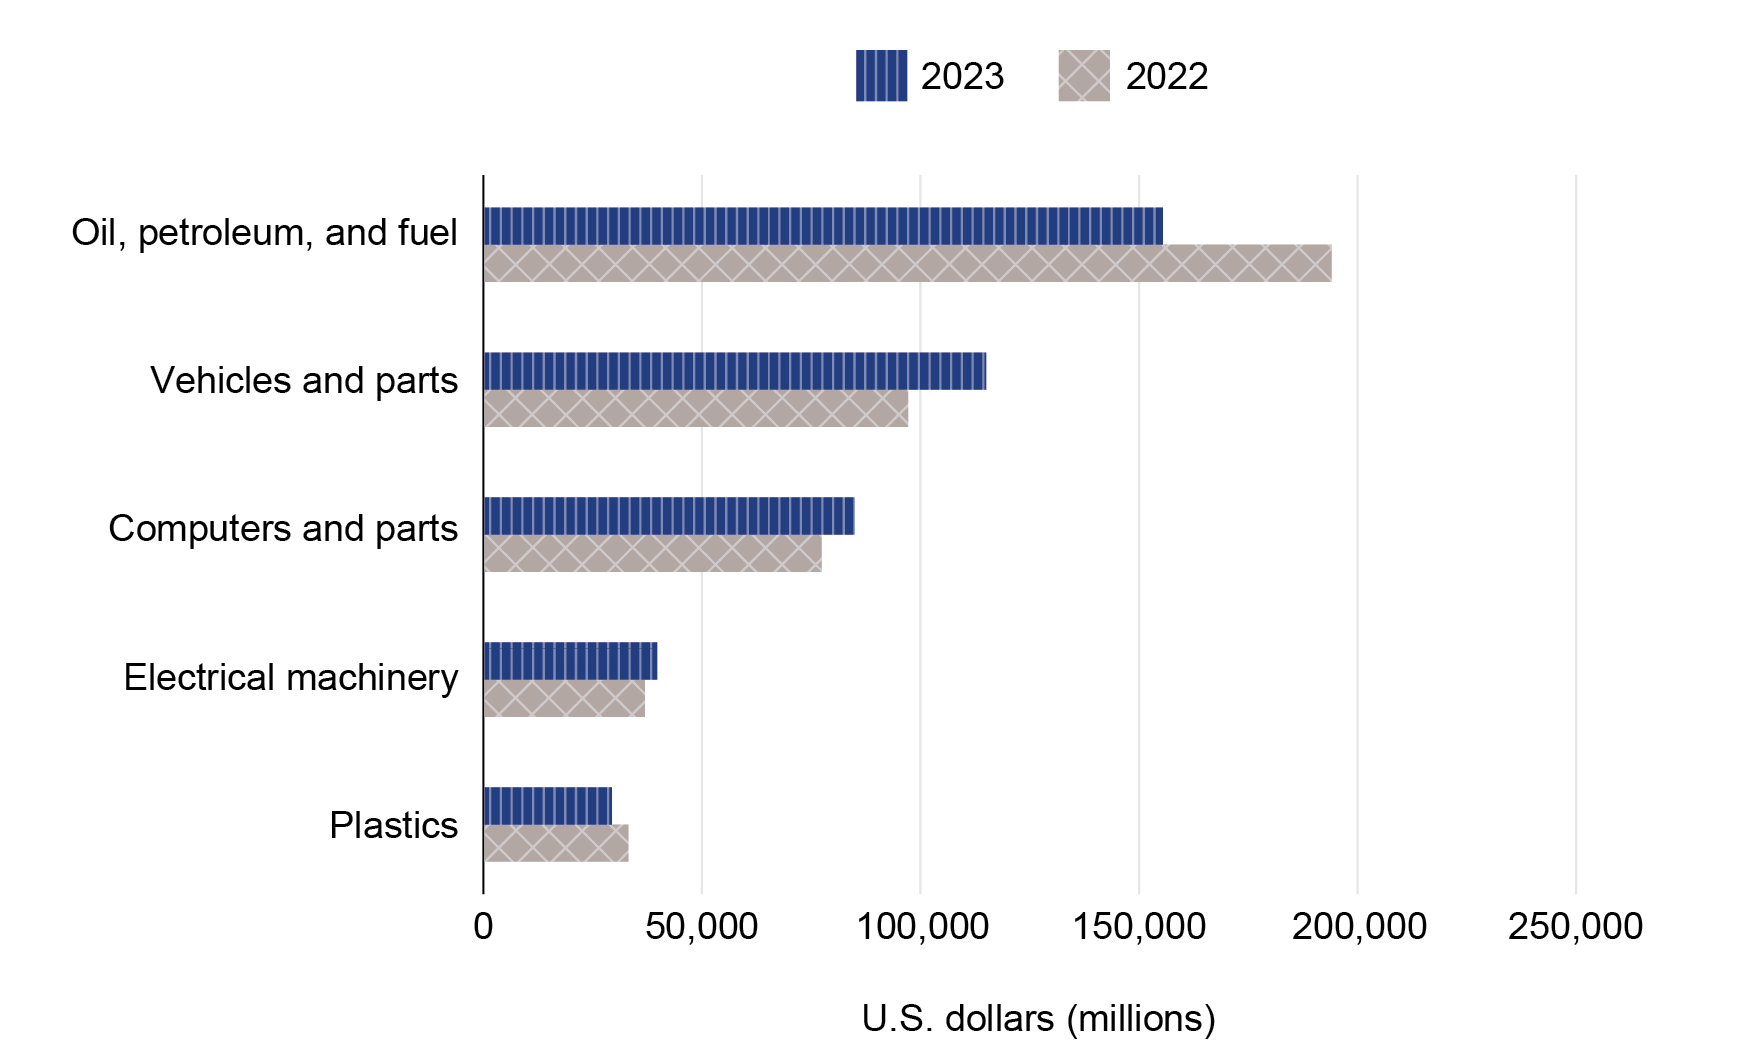
Figure 5b: Top U.S.-Mexico Commodities by Value (Millions USD): 2022 - 2023
Source: Bureau of Transportation Statistics, Transborder Freight Data, available at https://data.bts.gov/stories/s/myhq-rm6q, adapted from U.S. Census Bureau, International Trade in Goods and Services. Since the pandemic in 2020, truck freight has grown faster than rail freight for U.S. trade with Canada and Mexico combined (Figure 5). In 2022, trucks shipped $996.4 billion worth of goods from and to Canada and Mexico, while rail accounted for $209.2 billion. From 2022 to 2023, the value of truck freight increased by 5.1 percent while rail decreased by 0.47 percent.
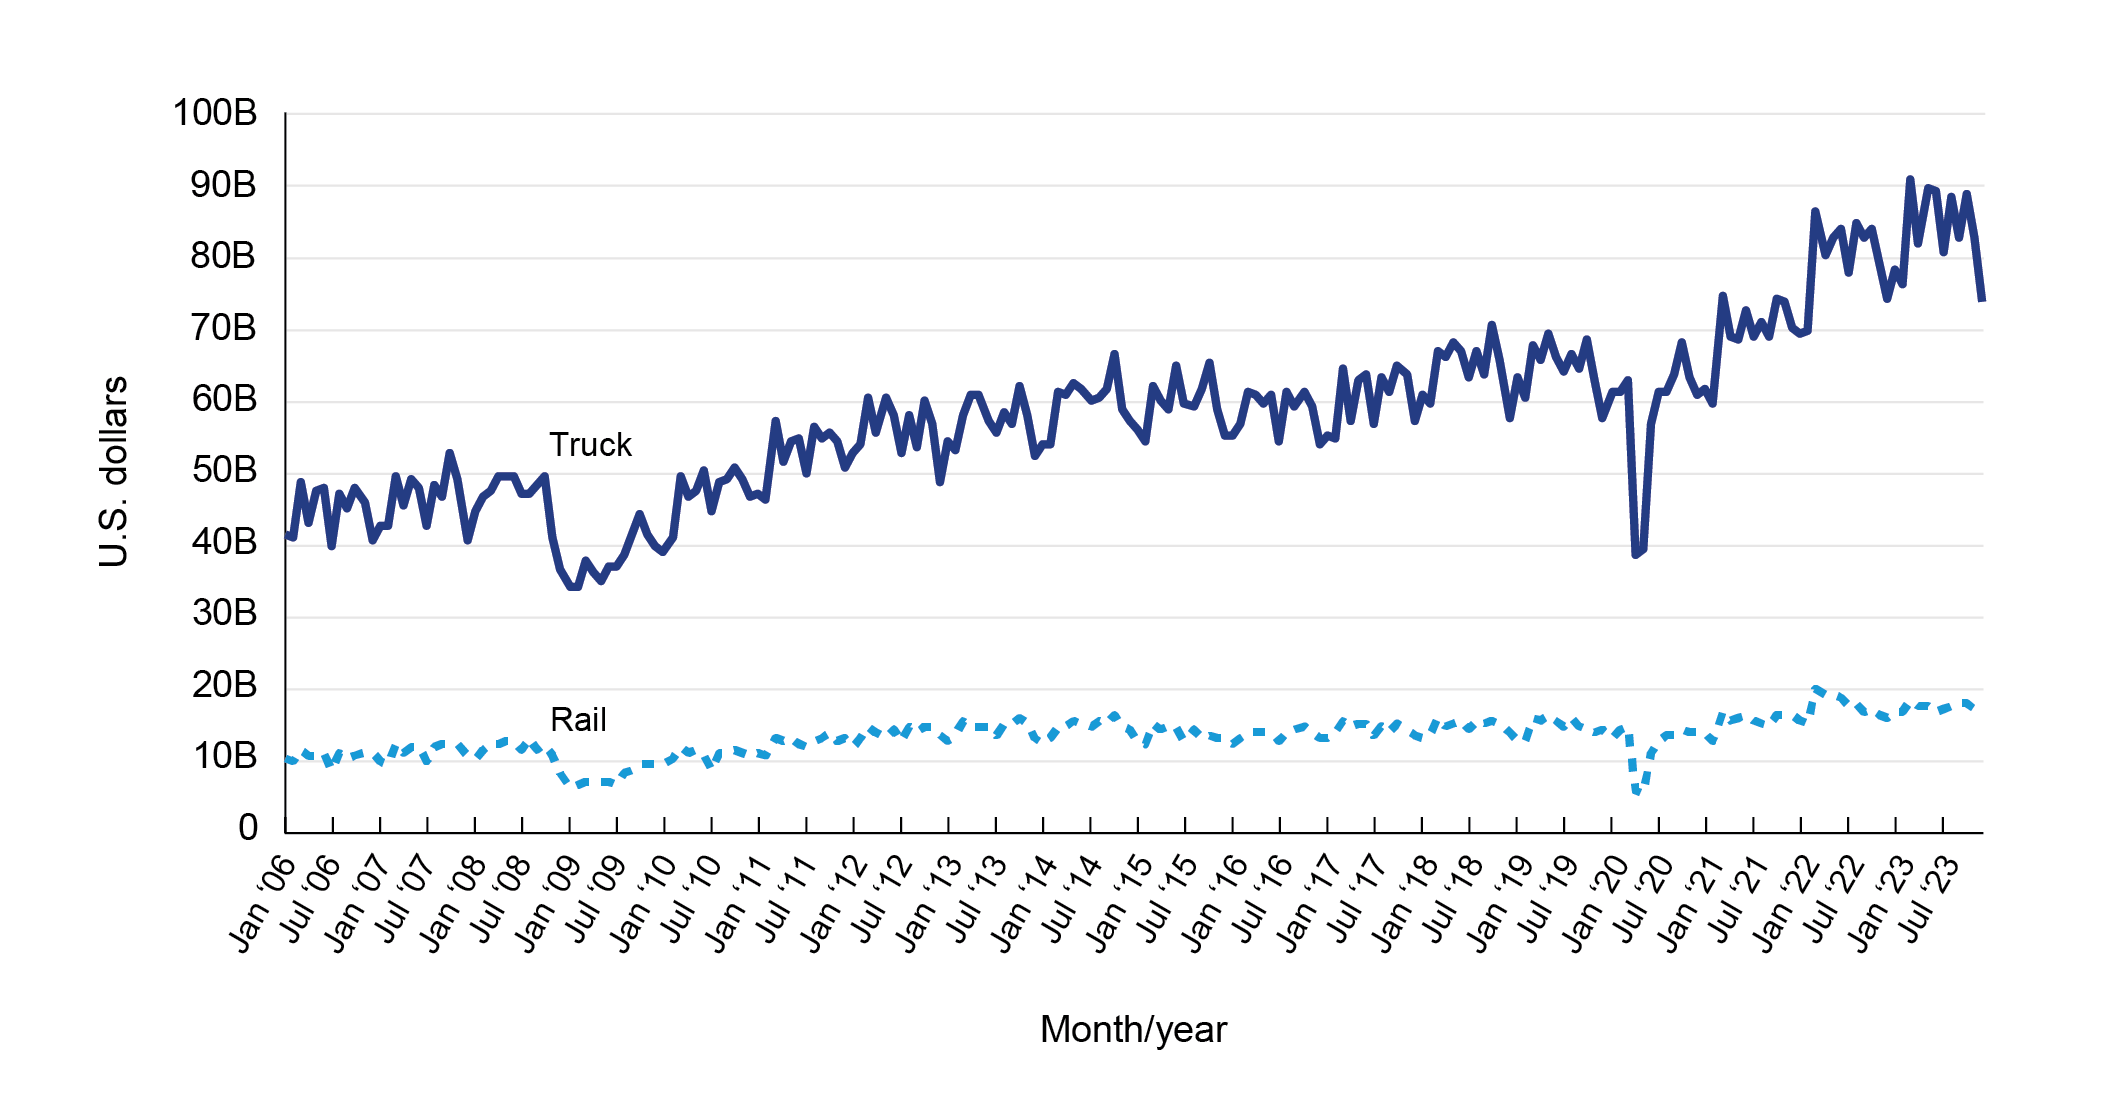
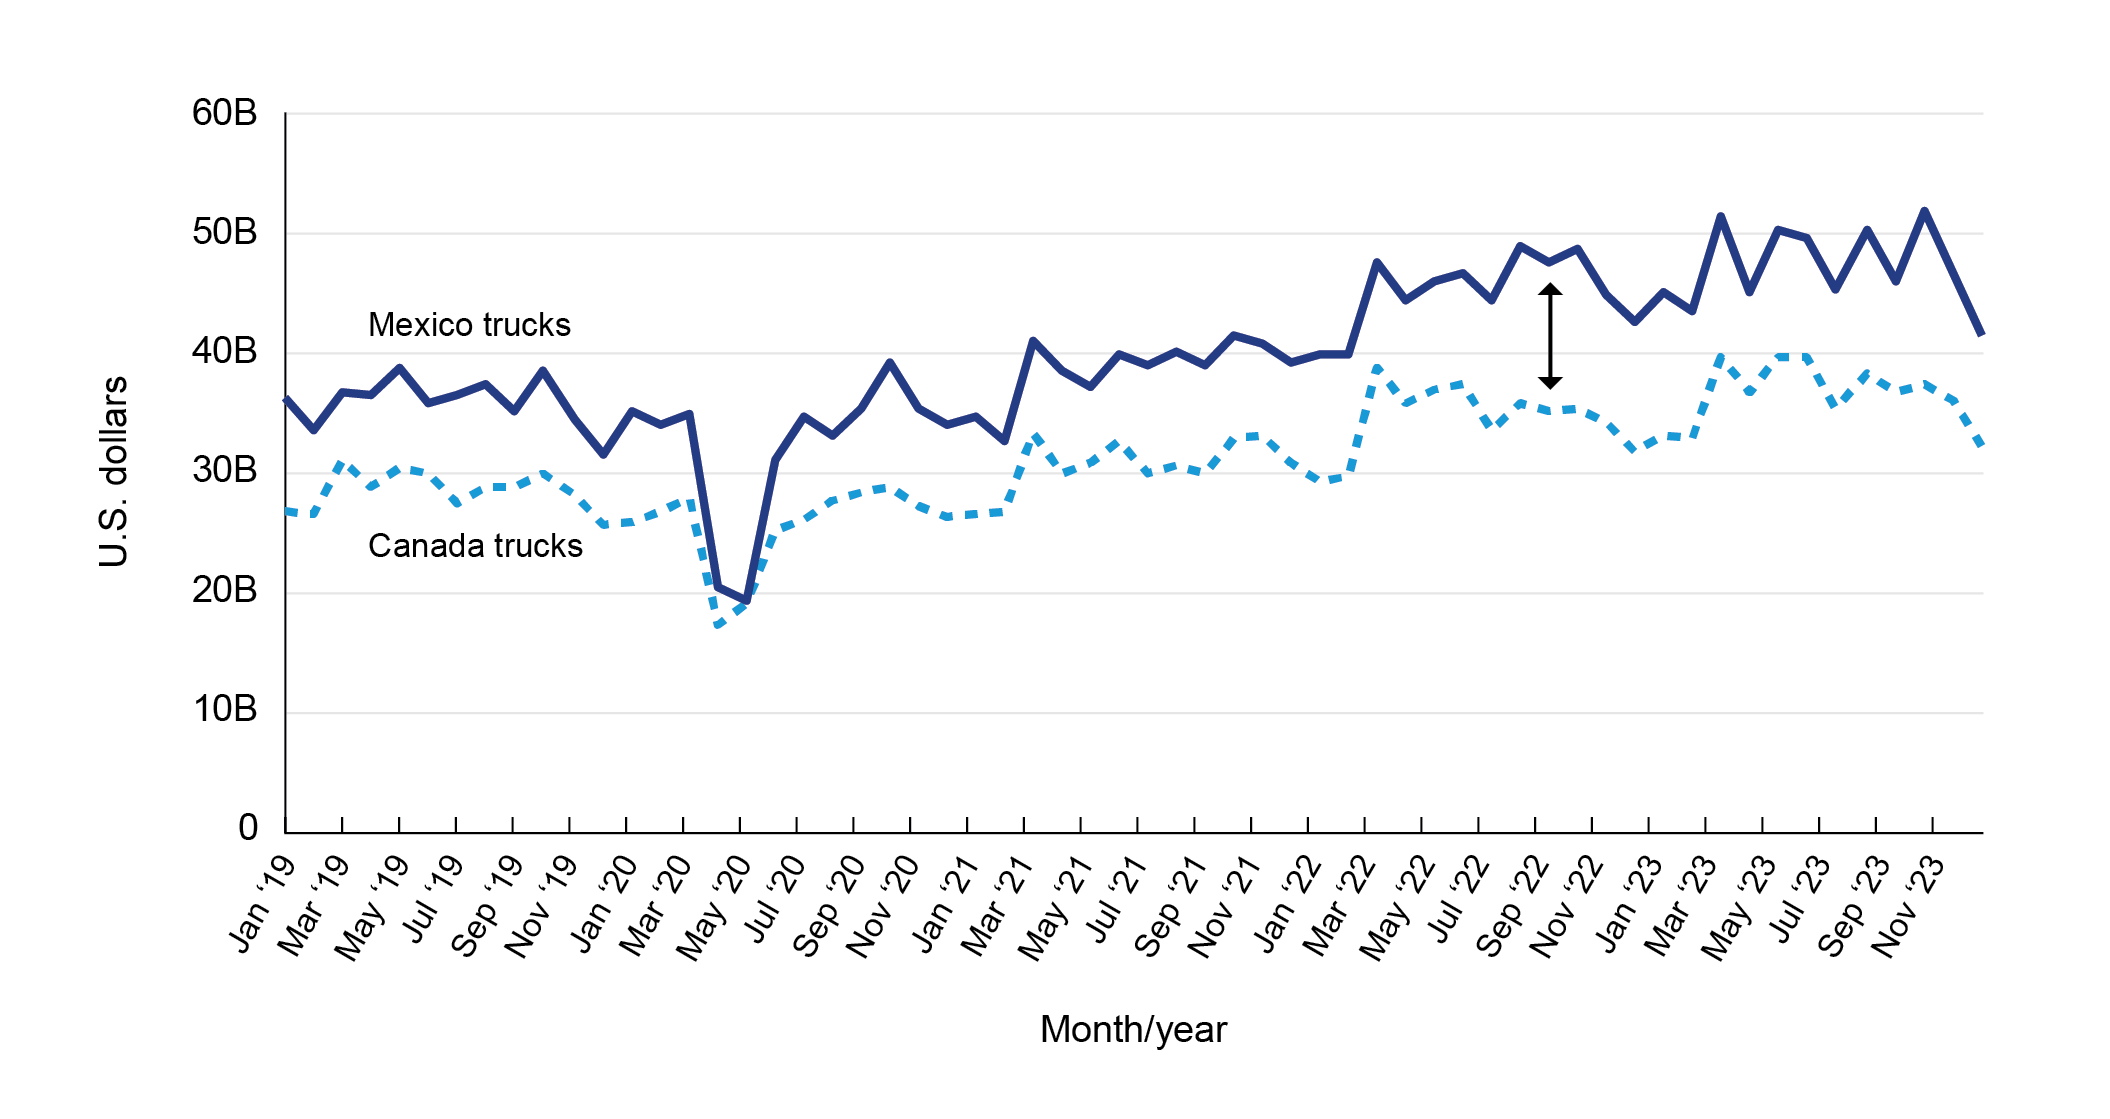
Figure 6. Value of U.S. Freight by Truck and Rail with Canada and Mexico (USD Actual)
Source: Bureau of Transportation Statistics, Transborder Freight Data, available at https://data.bts.gov/stories/s/myhq-rm6q, adapted from U.S. Census Bureau, International Trade in Goods and Services.
Figure 6 expands the truck data to show freight moved by trucks coming to and from Mexico and Canada. U.S. freight transportation by truck with Mexico increased at a faster pace than Canada since 2020. From the pandemic lows in April 2020 to December 2023, freight by truck with Canada has increased from $17.8 billion to $32.1 billion while freight by truck with Mexico has grown from $20.8 billion to $41.1 billion.
Source: Bureau of Transportation Statistics, Transborder Freight Data, available at https://data.bts.gov/stories/s/myhq-rm6q, adapted from U.S. Census Bureau, International Trade in Goods and Services.
| ||||||||||||||||||||||||||||||||||||||||||||||||||||||||||||||||||||||||||||||||||||||||||||||||||||||
.


Copyright © 2015 : All.Semua

0 Komentar untuk "TransBorder Freight Annual Report 2023"