
BTS 12-23 Thursday, March 9, 2023 Contact: BTS Media Tel: 1-800-853-1351 December 2022 U.S. Airline Traffic Data
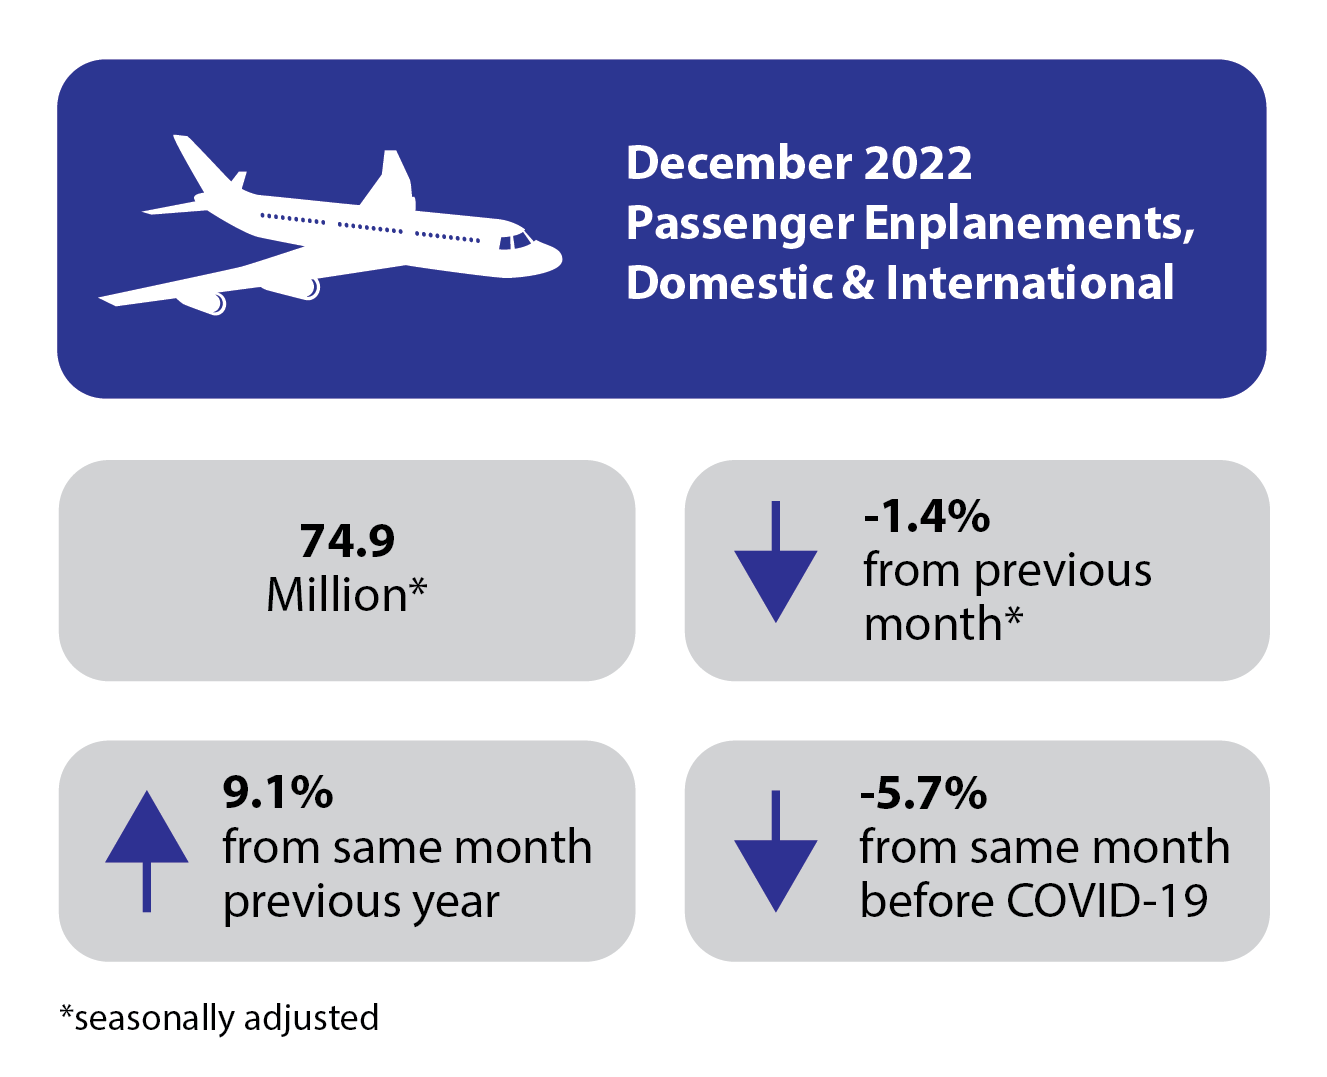
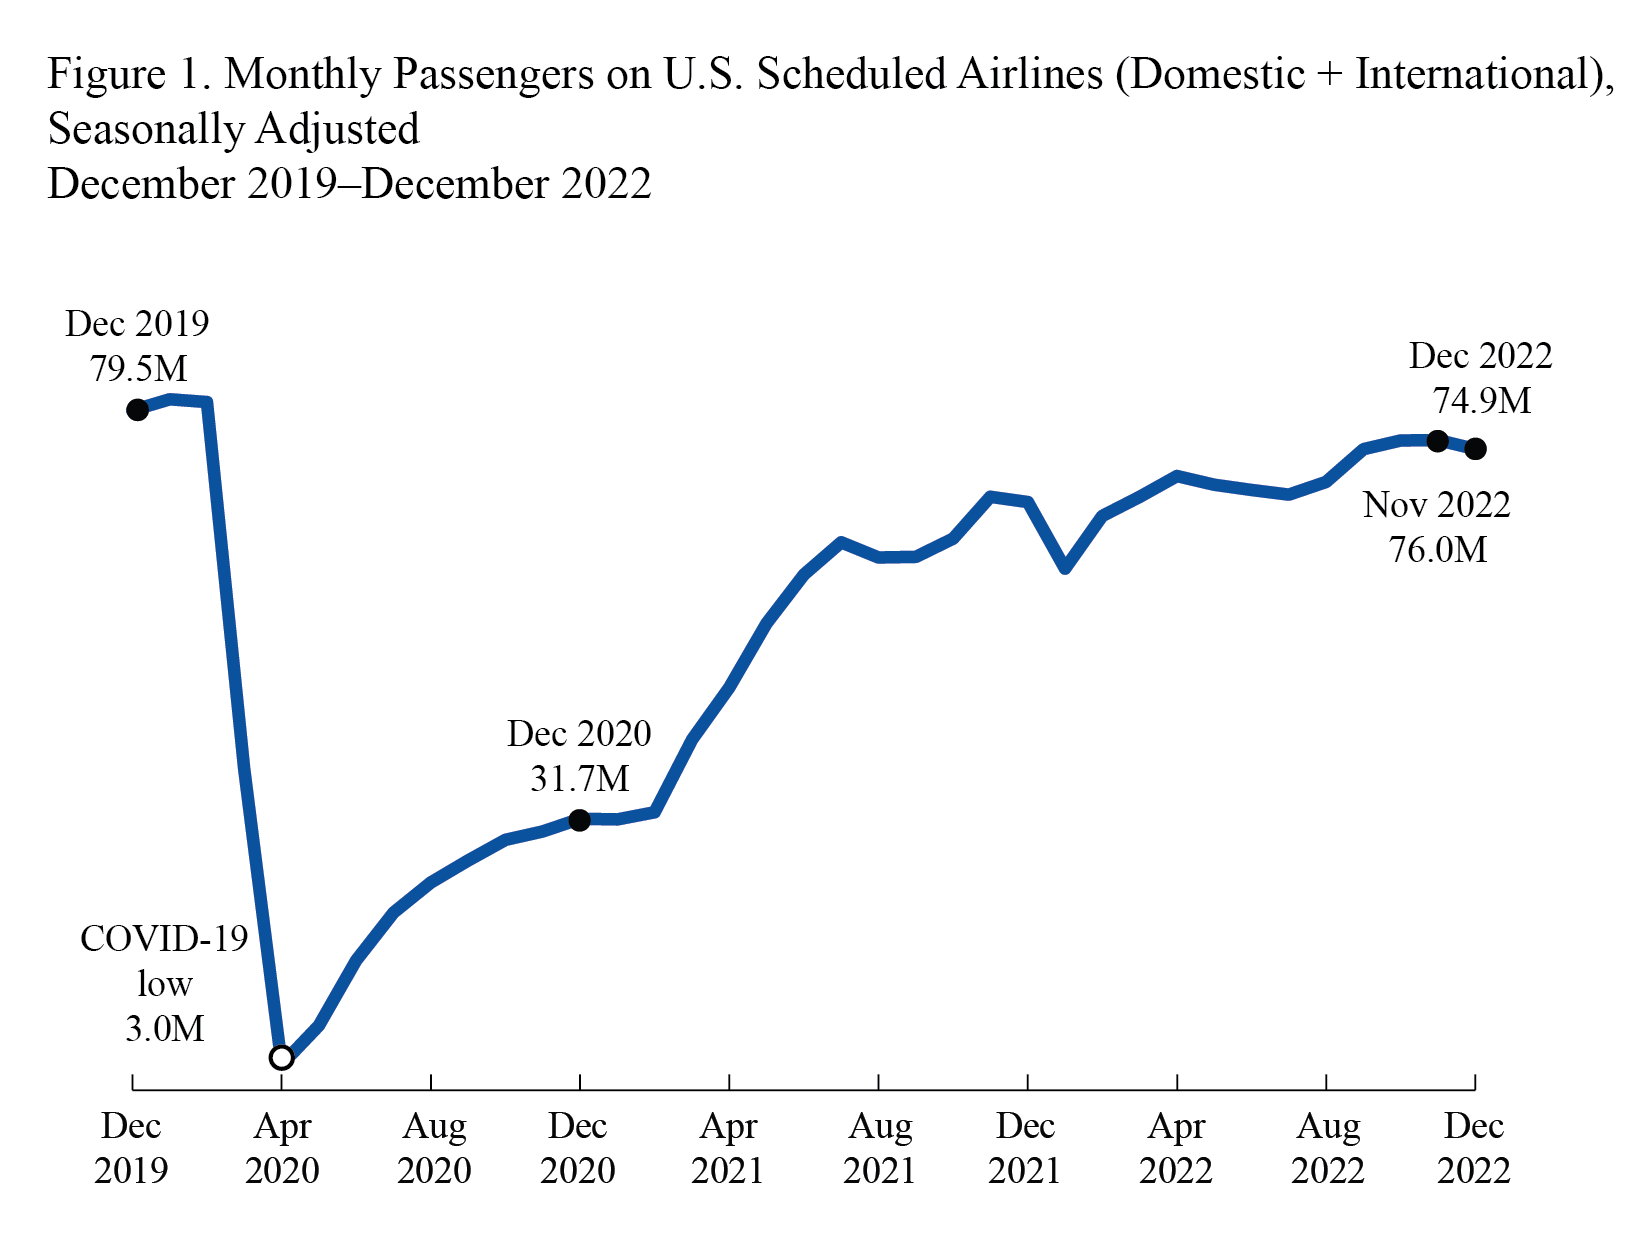
U.S. airlines carried 74.9 million systemwide (domestic and international) scheduled service passengers in December 2022, seasonally adjusted, according to the Bureau of Transportation Statistics' (BTS), down 1.4% from November. BTS reported 65.5 million domestic passengers and 9.4 million international passengers on U.S. airlines flights in December. U.S. airline traffic reports are filed monthly with BTS. See the tables that accompany this release on the BTS website for summary data since 2016 (Tables 1-24) and complete data since 2000.
Two measures of U.S. airlines passenger enplanements: December seasonally adjusted
December unadjusted
Table A. Seasonally Adjusted Passenger Enplanements Compared to Previous Time Periods
Table B. Unadjusted Passenger Enplanements Compared to Previous Time Periods
For data filed through December, see accompanying tables. For the complete database of reported data, see Traffic. For an explanation of BTS' seasonal adjustment methodology, see Seasonal Adjustment.
Reporting Notes Data are compiled from monthly reports filed with BTS by commercial U.S. air carriers detailing operations, passenger traffic and freight traffic. This release includes data received by BTS from 77 U.S. carriers as of March 3 for U.S. carrier scheduled civilian operations. See the BTS Airlines and Airports page for additional scheduled service numbers through December for U.S. airlines. International data by origin and destination is available through September. International totals in this press release consist of all U.S. carrier operations to and from the U.S. and from one foreign point to another foreign point. BTS' Airlines and Airports page does not include U.S. carriers' foreign point-to-point flights. BTS has scheduled April 13th for the release of data through January. None of the data are from samples. Measures of statistical significance do not apply to the complete air traffic data. Missing carriers: 2HQ (Elite) has not reported since July. ExpressJet (EV) is in Chapter 11 and discontinued operations on August 22; there are no operations to report for September and beyond.
| ||||||||||||||||||||||||||||||||||||||||||||


0 Komentar untuk "December 2022 U.S. Airline Traffic Data"