| BTS 10-23
February 21, 2023
Contact: BTSnews@dot.gov North American Transborder Freight up 3.5% in December 2022 from December 2021 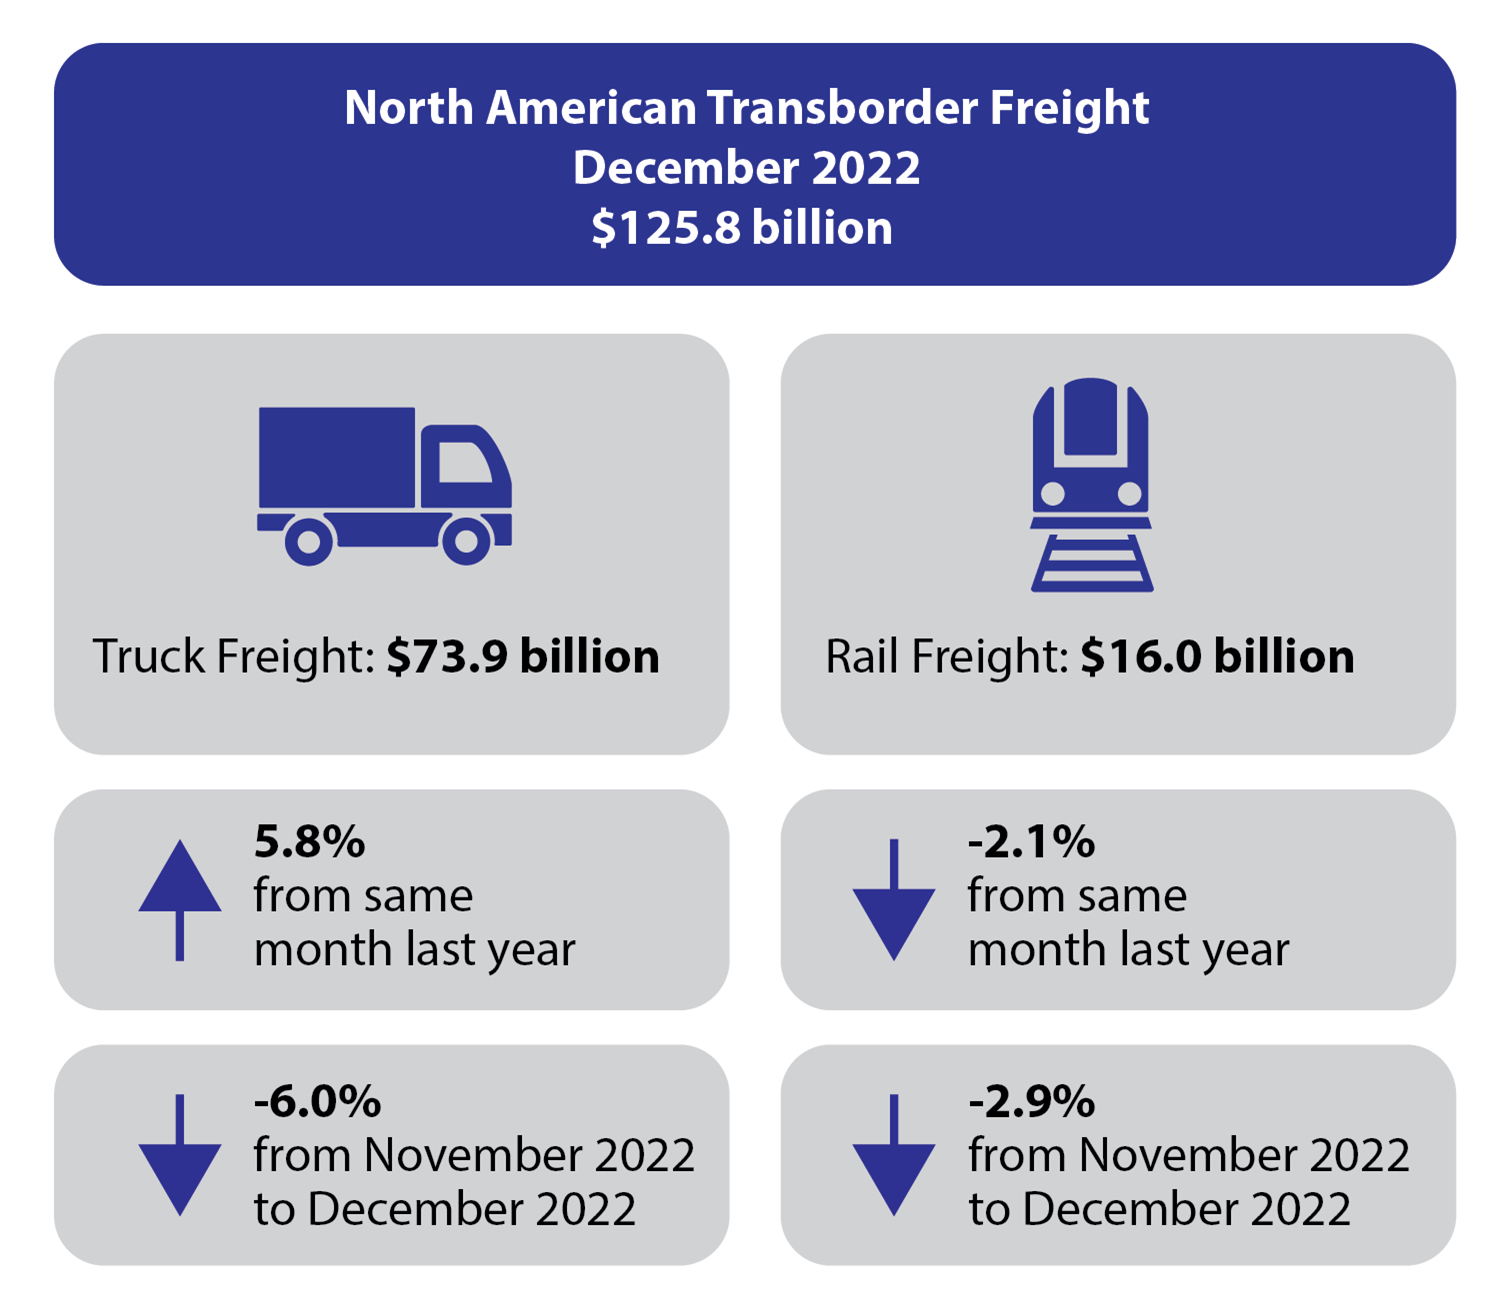
*Transborder freight is measured by value and is not adjusted for seasonal variation or inflation. The statistics in this release may not reflect changes in tonnage moved. Total Transborder Freight by Border in December 2022, Compared to December 2021:
Transborder freight between the U.S. and North American countries (Canada and Mexico) in December 2022: - Total transborder freight: $121.7 billion of transborder freight moved by all modes of transportation, up 3.5% compared to December 2021
- Freight between the U.S. and Canada totaled $60.7 billion, up 0.2% from December 2021
- Freight between the U.S. and Mexico totaled $61.0 billion, up 7.0% from December 2021
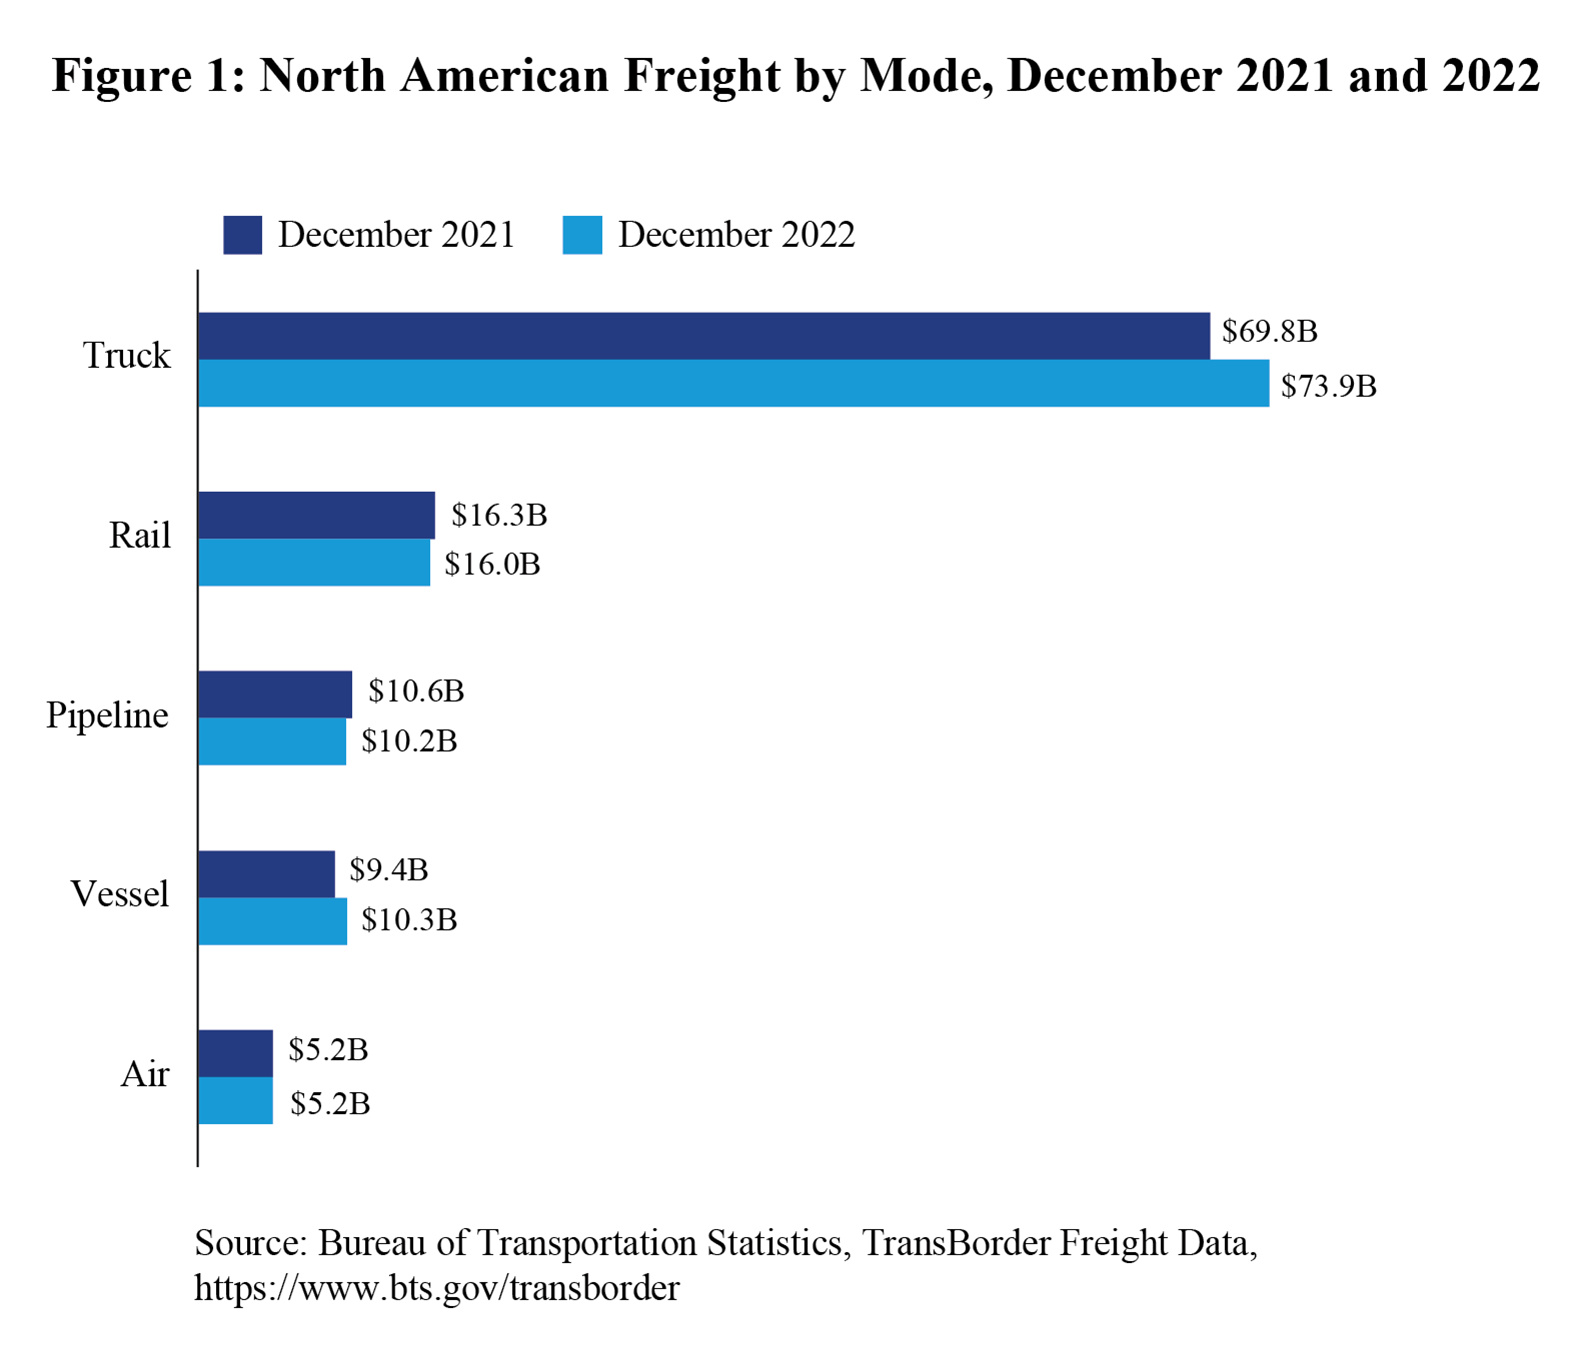
- Trucks moved $73.9 billion of freight, up 5.8% compared to December 2021
- Railways moved $16.0 billion of freight, down 2.1% compared to December 2021
- Pipelines moved $10.2 billion of freight, down 4.1% compared to December 2021
- Vessels moved $10.3 billion of freight, up 8.9% compared to December 2021
- Air moved $5.2 billion of freight, down 0.4% compared to December 2021
In December 2022, the Keystone pipeline from Canada was temporarily shut down due to an oil spill in Washington County, Kansas after bending stress and a weld flaw.3 Energy suppliers responded by shifting to vessels to compensate for the pipeline capacity shortfall. Total Transborder Freight by Border and Mode: U.S.-Canada (both directions)
(Dollars in Billions)
Truck: $31.7
Pipeline: $9.2
Rail: $8.7
Vessel: $3.3
Air: $3.3 | U.S.-Mexico (both directions)
(Dollars in Billions)
Truck: $42.1
Rail: $7.3
Vessel: $7.0
Air: $1.8
Pipeline: $1.0 | The dollar value of oil increased by 6.6% in December 2022 compared to December 2021, which contributed to year-over-year increases in the value of freight moved by vessel with Canada and Mexico. (1)(2) Port of Houston, Arthur, and Texas City are the top water port connections for U.S. energy flows with Mexico. | U.S.-Canada Trade Breakdown Top three truck ports
Detroit, MI $9.7 billion
Port Huron, MI $5.2 billion
Buffalo, NY $5.0 billion Top three truck commodities
Computers/parts $5.3 billion
Vehicles/parts $4.8 billion
Electrical machinery $2.3 billion Top three rail ports
Detroit, MI $2.4 billion
Port Huron, MI $2.2 billion
Int'l Falls, MN $1.2 billion
Top three rail commodities
Vehicles/part $3.2 billion
Mineral fuel $0.8 billion
Fertilizers $0.5 billion
| U.S.-Mexico Trade Breakdown Top three truck ports
Laredo, TX $19.7 billion
El Paso-Ysleta, TX $5.8 billion
Otay Mesa, CA $4.3 billion Top three truck commodities
Computers/parts $9.4 billion
Electrical machinery $9.2 billion
Vehicles/parts $5.9 billion Top three rail ports
Laredo, TX $3.9 billion
Eagle Pass, TX $2.0 billion
El Paso, TX $0.6 billion
Top three rail commodities
Vehicles/parts $3.6 billion
Computers/part $0.6 billion
Cereals $0.4 billion
| Reporting Notes Data in this Bureau of Transportation Statistics release are not seasonally adjusted and are not adjusted for inflation. For previous statistical releases and summary tables, see transborder releases. See transborder freight data for data from previous months, and additional state, port, and commodity data. BTS has scheduled the next release of transborder numbers for March 22, 2023.
1 Changes are due to fluctuations in the price of oil, volume, and weight. 2 WTI Spot Price: https://www.eia.gov/dnav/pet/hist/LeafHandler.ashx?n=pet&s=rwtc&f=m 3 https://www.tcenergy.com/incident/milepost-14-incident
| U.S. Department of Transportation | 1200 New Jersey Avenue, SE | Washington DC 20590 | 855-368-4200 |  | |


0 Komentar untuk "North American Transborder Freight up 3.5% in December 2022 from December 2021"